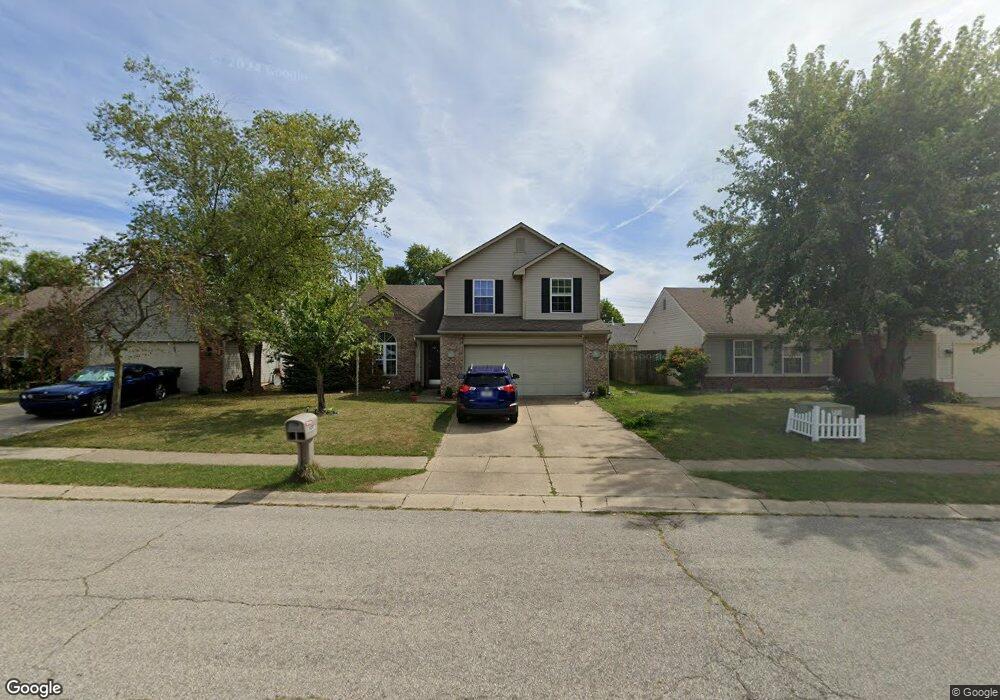
13091 Sterling Commons Fishers, IN 46038
Estimated Value: $320,000 - $336,887
3
Beds
3
Baths
1,652
Sq Ft
$199/Sq Ft
Est. Value
About This Home
This home is located at 13091 Sterling Commons, Fishers, IN 46038 and is currently estimated at $328,222, approximately $198 per square foot. 13091 Sterling Commons is a home located in Hamilton County with nearby schools including Cumberland Road Elementary School, East Middle School, and Fishers Junior High School.
Ownership History
Date
Name
Owned For
Owner Type
Purchase Details
Closed on
Mar 22, 2019
Sold by
Peo Michael R and Peo Patricia L
Bought by
Benabderhim Sofiane and Boucherrab Ouiza
Current Estimated Value
Home Financials for this Owner
Home Financials are based on the most recent Mortgage that was taken out on this home.
Original Mortgage
$190,120
Outstanding Balance
$166,464
Interest Rate
4.3%
Mortgage Type
New Conventional
Estimated Equity
$161,758
Purchase Details
Closed on
Feb 28, 2013
Sold by
Petro Mark A
Bought by
Peo Michael R and Peo Patricia L
Home Financials for this Owner
Home Financials are based on the most recent Mortgage that was taken out on this home.
Original Mortgage
$139,428
Interest Rate
3.25%
Mortgage Type
FHA
Create a Home Valuation Report for This Property
The Home Valuation Report is an in-depth analysis detailing your home's value as well as a comparison with similar homes in the area
Home Values in the Area
Average Home Value in this Area
Purchase History
| Date | Buyer | Sale Price | Title Company |
|---|---|---|---|
| Benabderhim Sofiane | -- | None Available | |
| Peo Michael R | -- | First Ameican Title Ins |
Source: Public Records
Mortgage History
| Date | Status | Borrower | Loan Amount |
|---|---|---|---|
| Open | Benabderhim Sofiane | $190,120 | |
| Previous Owner | Peo Michael R | $139,428 |
Source: Public Records
Tax History Compared to Growth
Tax History
| Year | Tax Paid | Tax Assessment Tax Assessment Total Assessment is a certain percentage of the fair market value that is determined by local assessors to be the total taxable value of land and additions on the property. | Land | Improvement |
|---|---|---|---|---|
| 2024 | $3,245 | $284,500 | $77,000 | $207,500 |
| 2023 | $3,030 | $277,400 | $39,700 | $237,700 |
| 2022 | $2,804 | $243,100 | $39,700 | $203,400 |
| 2021 | $2,245 | $200,500 | $39,700 | $160,800 |
| 2020 | $1,920 | $177,400 | $39,700 | $137,700 |
| 2019 | $1,782 | $167,600 | $28,500 | $139,100 |
| 2018 | $1,673 | $155,900 | $28,500 | $127,400 |
| 2017 | $1,479 | $148,500 | $28,500 | $120,000 |
| 2016 | $1,326 | $138,900 | $28,500 | $110,400 |
| 2014 | $1,118 | $129,600 | $28,500 | $101,100 |
| 2013 | $1,118 | $124,200 | $28,500 | $95,700 |
Source: Public Records
Map
Nearby Homes
- 12991 Wingstem Ct
- 12959 Shandon Ln
- 11798 & 11842 E 131st St
- 12677 Ladson St
- 10066 Perlita Place
- 10150 Beresford Ct
- 13068 Lamarque Place
- 13125 Zinfandel Place
- 10175 Pamona Ct
- 13048 Ross Crossing
- 9080 Teaneck Dr
- 12966 Pleasant View Ln
- 9050 Sparta Dr
- 10093 Parkshore Dr
- 13068 Raritan Dr
- 13853 Oak Grove Ct
- 9009 Mercer Dr
- 9335 Clarendon Dr
- 10523 Hollowood Ct
- 13854 Meadow Grass Way
- 13091 Sterling Commons
- 13087 Sterling Commons
- 13095 Sterling Commons
- 13087 Sterling Commons
- 13095 Sterling Commons
- 13083 Sterling Commons
- 13028 Wingstem Ct
- 13083 Sterling Commons
- 13099 Sterling Commons Unit 159
- 13099 Sterling Commons
- 13099 Sterling Commons
- 13024 Wingstem Ct
- 13079 Sterling Commons
- 13090 Sterling Commo
- 13090 Sterling Commons
- 13032 Wingstem Ct
- 13079 Sterling Commons
- 13090 Sterling Commons
- 13086 Sterling Commons
- 13020 Wingstem Ct