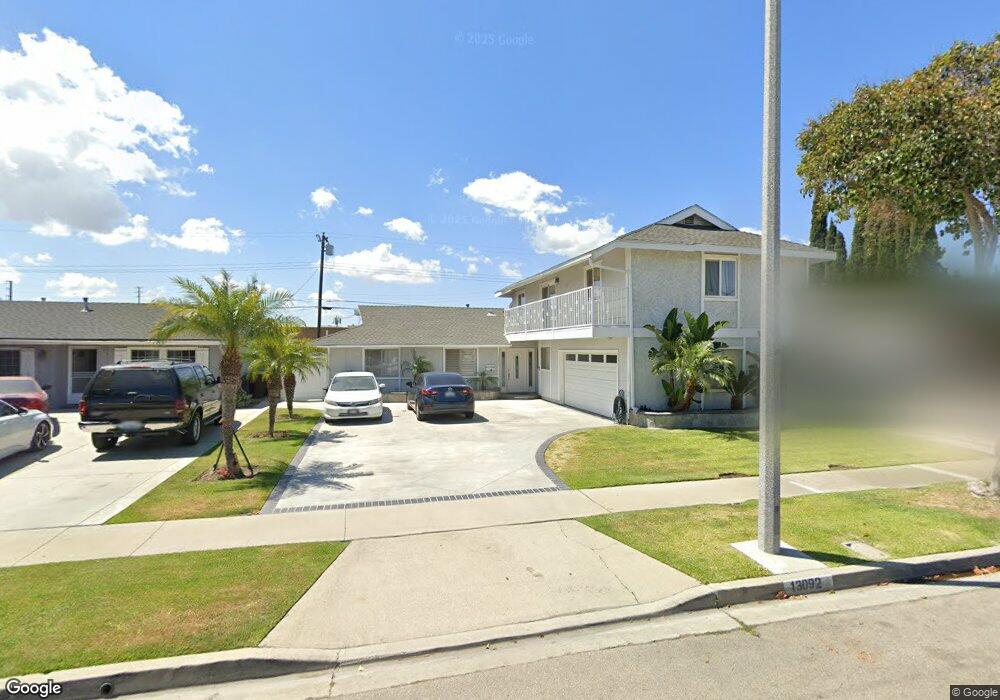
13092 Dunklee Ave Garden Grove, CA 92840
Estimated Value: $1,076,000 - $1,367,000
5
Beds
3
Baths
2,540
Sq Ft
$478/Sq Ft
Est. Value
About This Home
This home is located at 13092 Dunklee Ave, Garden Grove, CA 92840 and is currently estimated at $1,212,852, approximately $477 per square foot. 13092 Dunklee Ave is a home located in Orange County with nearby schools including Lampson Elementary School, Portola Middle School, and Orange High School.
Ownership History
Date
Name
Owned For
Owner Type
Purchase Details
Closed on
Apr 13, 2025
Sold by
Zuniga Jose L and Zuniga Maria L
Bought by
Zuniga Family Trust and Zuniga
Current Estimated Value
Purchase Details
Closed on
Jul 7, 1999
Sold by
Chavarin Jose and Chavarin Ignacia
Bought by
Zuniga Jose L and Zuniga Maria L
Home Financials for this Owner
Home Financials are based on the most recent Mortgage that was taken out on this home.
Original Mortgage
$200,000
Interest Rate
7.7%
Purchase Details
Closed on
May 15, 1999
Sold by
Chavarin Xavier R and Chavarin Inez Maria
Bought by
Chavarin Jose R and Chavarin Ignacia
Home Financials for this Owner
Home Financials are based on the most recent Mortgage that was taken out on this home.
Original Mortgage
$200,000
Interest Rate
7.7%
Create a Home Valuation Report for This Property
The Home Valuation Report is an in-depth analysis detailing your home's value as well as a comparison with similar homes in the area
Home Values in the Area
Average Home Value in this Area
Purchase History
| Date | Buyer | Sale Price | Title Company |
|---|---|---|---|
| Zuniga Family Trust | -- | California Title Company | |
| Zuniga Jose L | $250,000 | Gateway Title Company | |
| Chavarin Jose R | -- | Gateway Title Company | |
| Chavarin Jose R | -- | Gateway Title Company |
Source: Public Records
Mortgage History
| Date | Status | Borrower | Loan Amount |
|---|---|---|---|
| Previous Owner | Zuniga Jose L | $200,000 | |
| Closed | Zuniga Jose L | $25,000 |
Source: Public Records
Tax History Compared to Growth
Tax History
| Year | Tax Paid | Tax Assessment Tax Assessment Total Assessment is a certain percentage of the fair market value that is determined by local assessors to be the total taxable value of land and additions on the property. | Land | Improvement |
|---|---|---|---|---|
| 2025 | $4,725 | $391,895 | $262,806 | $129,089 |
| 2024 | $4,725 | $384,211 | $257,653 | $126,558 |
| 2023 | $4,619 | $376,678 | $252,601 | $124,077 |
| 2022 | $4,527 | $369,293 | $247,648 | $121,645 |
| 2021 | $4,405 | $362,052 | $242,792 | $119,260 |
| 2020 | $4,364 | $358,340 | $240,302 | $118,038 |
| 2019 | $4,308 | $351,314 | $235,590 | $115,724 |
| 2018 | $4,241 | $344,426 | $230,971 | $113,455 |
| 2017 | $4,075 | $337,673 | $226,442 | $111,231 |
| 2016 | $3,964 | $331,052 | $222,002 | $109,050 |
| 2015 | $3,906 | $326,080 | $218,668 | $107,412 |
| 2014 | $3,822 | $319,693 | $214,385 | $105,308 |
Source: Public Records
Map
Nearby Homes
- 13141 Windsor Ln
- 12560 Haster St Unit 204
- 12560 Haster St Unit 205
- 12722 Aspenwood Ln
- 2302 Lori Ln
- 12812 Timber Rd Unit 22
- 12848 Timber Rd Unit 33
- 2321 Downie Place
- 13102 Partridge St Unit 7
- 13102 Partridge St Unit 54
- 4002 W El Rancho Ave
- 12414 Fallingleaf St
- 12842 Palm St Unit 108
- 12850 Palm St Unit 6
- 12691 Sweetbriar Dr
- 13096 Blackbird St Unit 82
- 13096 Blackbird St Unit 11
- 13096 Blackbird St Unit 164
- 13096 Blackbird St Unit 67
- 12621 Sweetbriar Dr
- 13102 Dunklee Ave
- 13082 Dunklee Ave
- 13112 Dunklee Ave
- 13062 Dunklee Ave
- 13091 Dunklee Ave
- 13081 Dunklee Ave
- 13122 Dunklee Ave
- 13101 Dunklee Ave
- 13071 Dunklee Ave
- 13052 Dunklee Ave
- 13132 Dunklee Ave
- 13111 Dunklee Ave
- 13092 Aspenwood Ave
- 13082 Aspenwood Ave
- 13121 Dunklee Ave
- 13102 Aspenwood Ave
- 12851 Adrian Cir
- 13072 Aspenwood Ave
- 13142 Dunklee Ave
- 13112 Aspenwood Ave