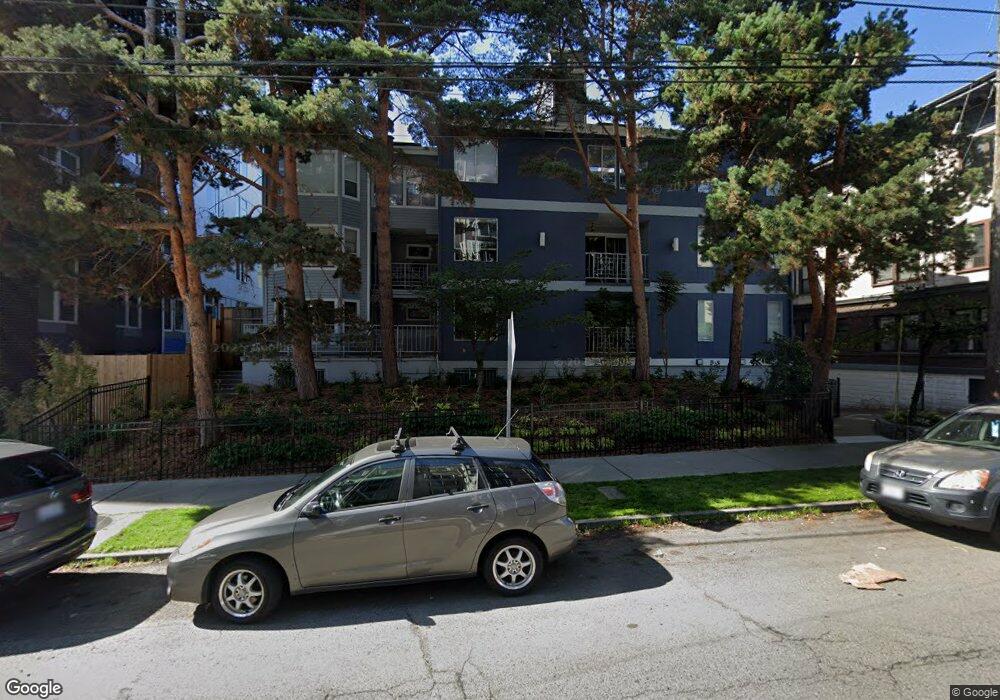
131 Bellevue Ave E Unit 301 Seattle, WA 98102
Capitol Hill NeighborhoodEstimated Value: $522,000 - $762,000
2
Beds
2
Baths
983
Sq Ft
$626/Sq Ft
Est. Value
About This Home
This home is located at 131 Bellevue Ave E Unit 301, Seattle, WA 98102 and is currently estimated at $615,336, approximately $625 per square foot. 131 Bellevue Ave E Unit 301 is a home located in King County with nearby schools including Lowell Elementary School, Meany Middle School, and Garfield High School.
Ownership History
Date
Name
Owned For
Owner Type
Purchase Details
Closed on
May 13, 2004
Sold by
Mullane Terrence E and Mullane Judy
Bought by
Pincus Robert H and Pincus Alice H
Current Estimated Value
Home Financials for this Owner
Home Financials are based on the most recent Mortgage that was taken out on this home.
Original Mortgage
$224,000
Outstanding Balance
$93,857
Interest Rate
4%
Estimated Equity
$521,479
Purchase Details
Closed on
Aug 15, 2003
Sold by
Mullane Judy and Hung Judy
Bought by
Mullane Terrence E and Mullane Judy
Home Financials for this Owner
Home Financials are based on the most recent Mortgage that was taken out on this home.
Original Mortgage
$207,000
Interest Rate
5.87%
Purchase Details
Closed on
Aug 18, 1993
Sold by
Cash Kelly C
Bought by
Hung Dick Tzn Tien and Hung Su+
Purchase Details
Closed on
Apr 18, 1992
Sold by
Leighty Kenneth E and Leighty Mary M
Bought by
Cash Kelly C
Create a Home Valuation Report for This Property
The Home Valuation Report is an in-depth analysis detailing your home's value as well as a comparison with similar homes in the area
Home Values in the Area
Average Home Value in this Area
Purchase History
| Date | Buyer | Sale Price | Title Company |
|---|---|---|---|
| Pincus Robert H | $280,000 | Fidelity Natio | |
| Mullane Terrence E | -- | Pacific Nw Tit | |
| Mullane Judy | -- | Pacific Nw Tit | |
| Mullane Judy | -- | Pacific Nw Tit | |
| Hung Dick Tzn Tien | $159,000 | -- | |
| Cash Kelly C | $147,000 | -- |
Source: Public Records
Mortgage History
| Date | Status | Borrower | Loan Amount |
|---|---|---|---|
| Open | Pincus Robert H | $224,000 | |
| Previous Owner | Mullane Terrence E | $207,000 |
Source: Public Records
Tax History Compared to Growth
Tax History
| Year | Tax Paid | Tax Assessment Tax Assessment Total Assessment is a certain percentage of the fair market value that is determined by local assessors to be the total taxable value of land and additions on the property. | Land | Improvement |
|---|---|---|---|---|
| 2024 | $4,607 | $485,000 | $286,400 | $198,600 |
| 2023 | $4,710 | $585,000 | $286,400 | $298,600 |
| 2022 | $4,556 | $564,000 | $279,200 | $284,800 |
| 2021 | $4,520 | $502,000 | $279,200 | $222,800 |
| 2020 | $4,973 | $473,000 | $286,400 | $186,600 |
| 2018 | $4,769 | $546,000 | $247,000 | $299,000 |
| 2017 | $4,044 | $489,000 | $254,200 | $234,800 |
| 2016 | $3,656 | $428,000 | $89,500 | $338,500 |
| 2015 | $3,337 | $377,000 | $89,500 | $287,500 |
| 2014 | -- | $352,000 | $89,500 | $262,500 |
| 2013 | -- | $322,000 | $89,500 | $232,500 |
Source: Public Records
Map
Nearby Homes
- 115 Bellevue Ave E Unit 105
- 150 Melrose Ave E Unit 105
- 103 Bellevue Ave E Unit 102
- 211 Summit Ave E Unit N108
- 211 Summit Ave E Unit S218
- 1740 Melrose Ave Unit 203
- 1740 Melrose Ave Unit 802
- 231 Summit Ave E
- 1805 Bellevue Ave Unit 503
- 505 E Denny Way Unit A106
- 505 E Denny Way Unit A304
- 505 E Denny Way Unit A506
- 505 E Denny Way Unit A207
- 505 E Denny Way Unit A507
- 219 Belmont Ave E
- 221 Belmont Ave E
- 318 Bellevue Ave E
- 231 Belmont Ave E Unit 404
- 231 Belmont Ave E Unit 310
- 516 E Thomas St Unit 105
- 131 Bellevue Ave E Unit 302
- 131 Bellevue Ave E Unit 102
- 131 Bellevue Ave E Unit 201
- 131 Bellevue Ave E Unit 103
- 131 Bellevue Ave E Unit 401
- 131 Bellevue Ave E Unit 305
- 131 Bellevue Ave E Unit 202
- 131 Bellevue Ave E Unit 304
- 131 Bellevue Ave E Unit 403
- 131 Bellevue Ave E Unit 205
- 131 Bellevue Ave E Unit 203
- 131 Bellevue Ave E Unit 101
- 131 Bellevue Ave E Unit 405
- 131 Bellevue Ave E Unit 404
- 131 Bellevue Ave E Unit 402
- 131 Bellevue Ave E Unit 303
- 131 Bellevue Ave E Unit 204
- 131 Bellevue Ave E
- 127 Bellevue Ave E
- 127 Bellevue Ave E