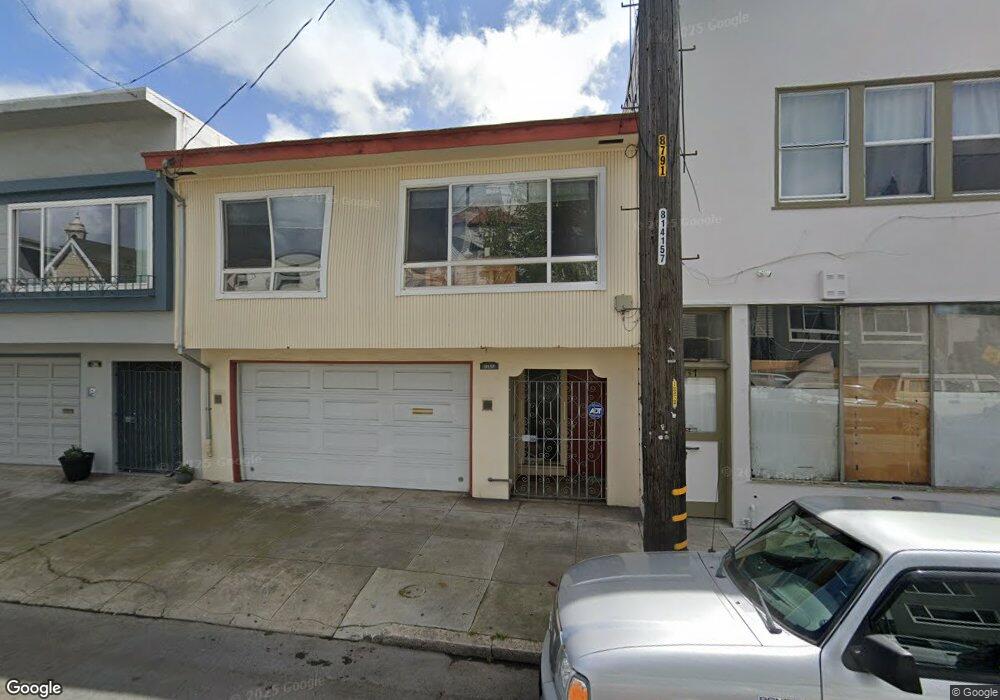
131 Bosworth St San Francisco, CA 94112
Bernal Heights NeighborhoodEstimated Value: $995,284 - $1,635,000
--
Bed
1
Bath
1,464
Sq Ft
$902/Sq Ft
Est. Value
About This Home
This home is located at 131 Bosworth St, San Francisco, CA 94112 and is currently estimated at $1,320,571, approximately $902 per square foot. 131 Bosworth St is a home located in San Francisco County with nearby schools including Glen Park Elementary School and James Lick Middle School.
Ownership History
Date
Name
Owned For
Owner Type
Purchase Details
Closed on
Sep 20, 2022
Sold by
Dizon Joyce M
Bought by
Joyce Dizon Amman Revocable Living Trust and Dizon
Current Estimated Value
Purchase Details
Closed on
Aug 21, 2007
Sold by
Manantan Mila S and Dizon Joyce M
Bought by
Dizon Joyce M
Purchase Details
Closed on
Aug 9, 1996
Sold by
Manantan Mila S
Bought by
Manantan Mila S
Purchase Details
Closed on
May 21, 1996
Sold by
Manantan Mila S
Bought by
Manantan Mila S
Home Financials for this Owner
Home Financials are based on the most recent Mortgage that was taken out on this home.
Original Mortgage
$135,000
Interest Rate
7.97%
Purchase Details
Closed on
Dec 2, 1993
Sold by
Manantan Mila S
Bought by
Manantan Mila S
Purchase Details
Closed on
Nov 26, 1993
Sold by
Manantan Mila S and Manantan Remedios S
Bought by
Manantan Mila S
Create a Home Valuation Report for This Property
The Home Valuation Report is an in-depth analysis detailing your home's value as well as a comparison with similar homes in the area
Home Values in the Area
Average Home Value in this Area
Purchase History
| Date | Buyer | Sale Price | Title Company |
|---|---|---|---|
| Joyce Dizon Amman Revocable Living Trust | -- | None Listed On Document | |
| Dizon Joyce M | -- | None Available | |
| Manantan Mila S | -- | -- | |
| Manantan Mila S | -- | North American Title Co | |
| Manantan Mila S | -- | -- | |
| Manantan Mila S | -- | -- |
Source: Public Records
Mortgage History
| Date | Status | Borrower | Loan Amount |
|---|---|---|---|
| Previous Owner | Manantan Mila S | $135,000 |
Source: Public Records
Tax History Compared to Growth
Tax History
| Year | Tax Paid | Tax Assessment Tax Assessment Total Assessment is a certain percentage of the fair market value that is determined by local assessors to be the total taxable value of land and additions on the property. | Land | Improvement |
|---|---|---|---|---|
| 2025 | $6,921 | $541,006 | $341,478 | $199,528 |
| 2024 | $6,921 | $530,399 | $334,783 | $195,616 |
| 2023 | $6,807 | $520,000 | $328,219 | $191,781 |
| 2022 | $1,630 | $83,106 | $22,393 | $60,713 |
| 2021 | $1,594 | $81,477 | $21,954 | $59,523 |
| 2020 | $1,623 | $80,642 | $21,729 | $58,913 |
| 2019 | $1,571 | $79,061 | $21,303 | $57,758 |
| 2018 | $1,519 | $77,512 | $20,886 | $56,626 |
| 2017 | $1,201 | $75,993 | $20,477 | $55,516 |
| 2016 | $1,148 | $74,504 | $20,076 | $54,428 |
| 2015 | $1,130 | $73,386 | $19,775 | $53,611 |
| 2014 | $1,101 | $71,949 | $19,388 | $52,561 |
Source: Public Records
Map
Nearby Homes
- 4041 Mission St
- 474 Arlington St Unit 478
- 4180 Mission St
- 447 Justin Dr
- 23 Richland Ave Unit 25
- 6 Roanoke St
- 87 Maynard St
- 201 Congdon St
- 8 Mateo St
- 225 Congdon St
- 268 Arlington St
- 246 Bemis St
- 111 Richland Ave
- 3759 Mission St
- 3755-3759 Mission St
- 200 Cayuga Ave
- 125 Leese St
- 73 Leese St
- 301 Maynard St
- 210 Laidley St
- 125 Bosworth St
- 137 Bosworth St
- 145 Bosworth St
- 121 Bosworth St
- 111 Cuvier St
- 115 Bosworth St Unit A
- 115 Bosworth St
- 113 Cuvier St
- 103 Bosworth St
- 124 Marsilly St
- 115 Cuvier St
- 130 Marsilly St
- 101 Bosworth St
- 130 Marsily
- 136 Bosworth St
- 142 Bosworth St
- 117 Cuvier St
- 136 Marsilly St
- 207 Bosworth St
- 108 Bosworth St