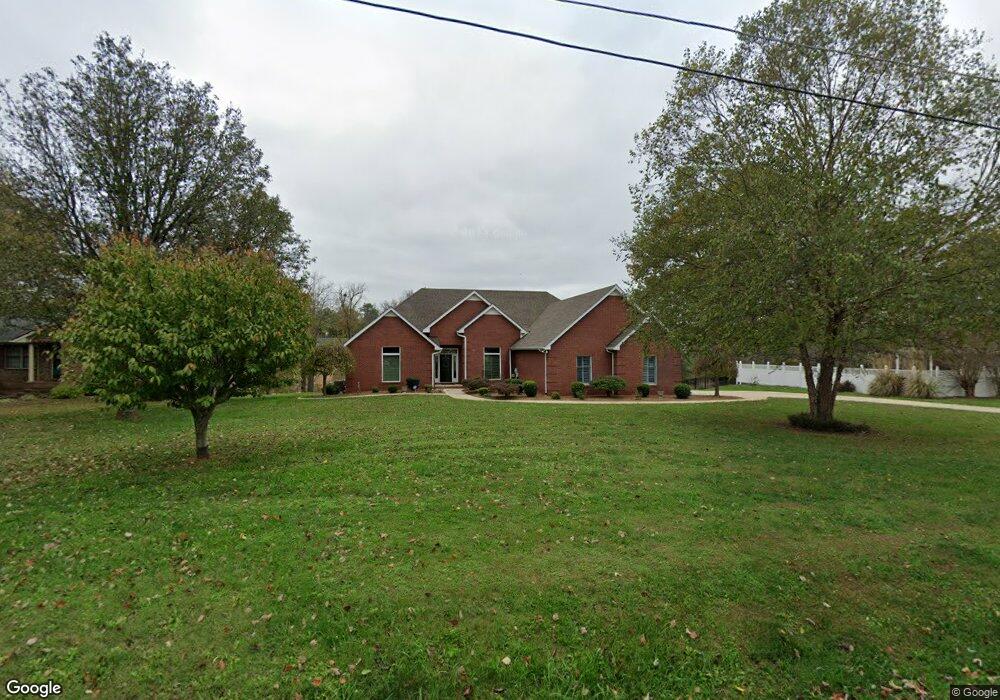
131 Brandi Way Winchester, TN 37398
Estimated Value: $606,000 - $1,260,000
--
Bed
3
Baths
2,425
Sq Ft
$391/Sq Ft
Est. Value
About This Home
This home is located at 131 Brandi Way, Winchester, TN 37398 and is currently estimated at $947,765, approximately $390 per square foot. 131 Brandi Way is a home located in Franklin County with nearby schools including North Middle School, Franklin County High School, and Winchester Christian Academy.
Ownership History
Date
Name
Owned For
Owner Type
Purchase Details
Closed on
Mar 18, 2022
Sold by
Linda Annette Capley Revocable Living Tr
Bought by
Capley Linda Annette
Current Estimated Value
Purchase Details
Closed on
Sep 3, 2021
Sold by
Capley Linda Annette
Bought by
Capley Linda Annette and Capley Rlt Linda Annette
Purchase Details
Closed on
Aug 28, 2015
Sold by
Capley N B
Bought by
Capley Linda Annette
Purchase Details
Closed on
Sep 5, 1997
Sold by
Feller H Vearl Eudean
Bought by
Capley N B Linda A
Purchase Details
Closed on
Jan 2, 1997
Bought by
Boswell John and Boswell Mavis E
Purchase Details
Closed on
Sep 16, 1993
Bought by
Mills Shirley Boswell
Purchase Details
Closed on
Jul 2, 1992
Bought by
Boswell John and Boswell Mavis E
Purchase Details
Closed on
Jan 28, 1991
Bought by
Hampton James E and Hampton Virginia
Purchase Details
Closed on
Feb 28, 1989
Bought by
Brock Gregory Brenda
Purchase Details
Closed on
Jul 8, 1985
Bought by
Boyer Albert J and Boyer Florence M
Create a Home Valuation Report for This Property
The Home Valuation Report is an in-depth analysis detailing your home's value as well as a comparison with similar homes in the area
Home Values in the Area
Average Home Value in this Area
Purchase History
| Date | Buyer | Sale Price | Title Company |
|---|---|---|---|
| Capley Linda Annette | -- | Murfree & Goodman Pllc | |
| Capley Linda Annette | -- | None Available | |
| Capley Linda Annette | -- | -- | |
| Capley N B Linda A | $40,000 | -- | |
| Boswell John | $10,000 | -- | |
| Mills Shirley Boswell | $41,500 | -- | |
| Boswell John | -- | -- | |
| Hampton James E | -- | -- | |
| Brock Gregory Brenda | -- | -- | |
| Boyer Albert J | -- | -- |
Source: Public Records
Tax History Compared to Growth
Tax History
| Year | Tax Paid | Tax Assessment Tax Assessment Total Assessment is a certain percentage of the fair market value that is determined by local assessors to be the total taxable value of land and additions on the property. | Land | Improvement |
|---|---|---|---|---|
| 2024 | $5,570 | $216,650 | $100,000 | $116,650 |
| 2023 | $5,570 | $216,650 | $100,000 | $116,650 |
| 2022 | $5,462 | $216,650 | $100,000 | $116,650 |
| 2021 | $3,329 | $216,650 | $100,000 | $116,650 |
| 2020 | $4,594 | $129,975 | $55,000 | $74,975 |
| 2019 | $4,594 | $129,975 | $55,000 | $74,975 |
| 2018 | $4,327 | $129,975 | $55,000 | $74,975 |
| 2017 | $4,327 | $129,975 | $55,000 | $74,975 |
| 2016 | $4,166 | $125,100 | $55,000 | $70,100 |
| 2015 | $4,089 | $125,100 | $55,000 | $70,100 |
| 2014 | $4,089 | $125,088 | $0 | $0 |
Source: Public Records
Map
Nearby Homes
- 0 Spring Hill Dr
- 510 N Porter St
- 1108 N Jefferson St
- 103 Lisa Cir
- 0 N Porter St
- 74 Summerlake Ct
- 0 Summerlake Ct Unit RTC2936678
- 0 Summerlake Ct Unit RTC2936679
- 0 Summerlake Ct Unit RTC2936676
- 0 Summerlake Ct Unit RTC2936675
- 0 Summerlake Ct Unit RTC2936677
- 0 Summerlake Ct Unit RTC2936673
- 0 Summerlake Ct Unit RTC2936674
- 114 11th Ave NW
- 715 N High St
- 906 N High St
- 303 N Porter St
- 706 N Vine St
- 111 Barefoot Way
- 124 Barefoot Way