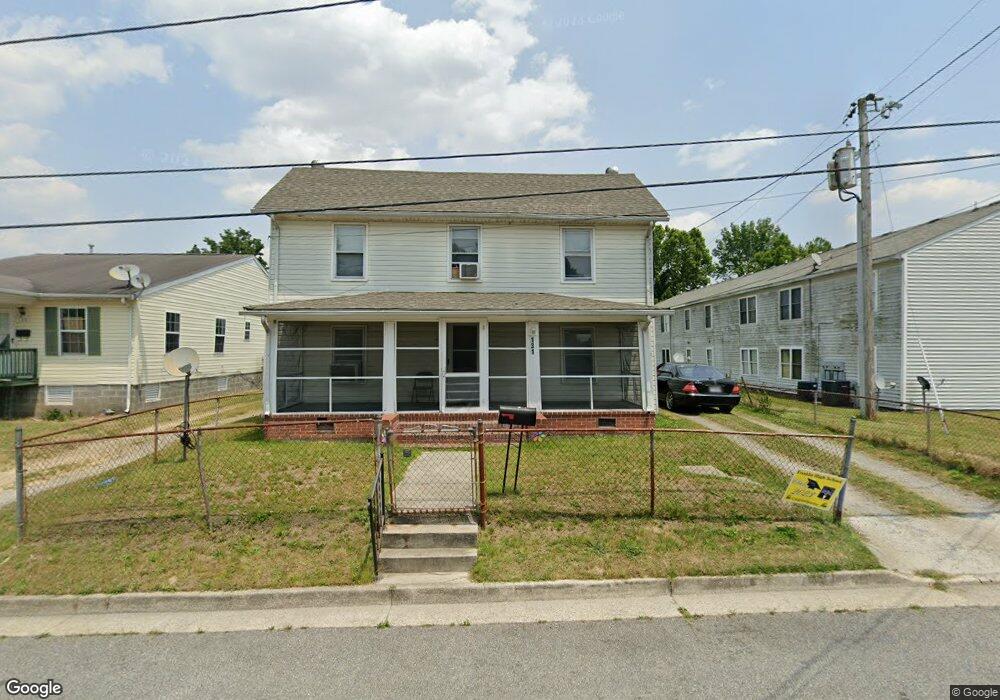
131 Broad St Franklin, VA 23851
Estimated Value: $138,000 - $200,000
3
Beds
2
Baths
1,542
Sq Ft
$116/Sq Ft
Est. Value
About This Home
This home is located at 131 Broad St, Franklin, VA 23851 and is currently estimated at $179,333, approximately $116 per square foot. 131 Broad St is a home located in Franklin City with nearby schools including S.P. Morton Elementary School, Joseph P. King Jr. Middle School, and Franklin High School.
Ownership History
Date
Name
Owned For
Owner Type
Purchase Details
Closed on
Oct 17, 2022
Sold by
Scaggs Nathaniel A
Bought by
Franklin Investments Llc
Current Estimated Value
Purchase Details
Closed on
May 18, 2022
Sold by
Scaggs Nathaniel A
Bought by
Franklin Investments Llc
Purchase Details
Closed on
Jan 24, 2017
Sold by
Nationstar Mortgage Llc Doing Business I
Bought by
Weinberg Properties Llc
Purchase Details
Closed on
Nov 30, 2016
Sold by
Equity Trustees Llc A Virginia Limited L
Bought by
Nationstar Mortgage Llc Doing Business I
Create a Home Valuation Report for This Property
The Home Valuation Report is an in-depth analysis detailing your home's value as well as a comparison with similar homes in the area
Home Values in the Area
Average Home Value in this Area
Purchase History
| Date | Buyer | Sale Price | Title Company |
|---|---|---|---|
| Franklin Investments Llc | -- | Fidelity National Title | |
| Franklin Investments Llc | $166,320 | New Title Company Name | |
| Weinberg Properties Llc | $25,000 | Attorney | |
| Nationstar Mortgage Llc Doing Business I | $33,500 | None Available |
Source: Public Records
Tax History
| Year | Tax Paid | Tax Assessment Tax Assessment Total Assessment is a certain percentage of the fair market value that is determined by local assessors to be the total taxable value of land and additions on the property. | Land | Improvement |
|---|---|---|---|---|
| 2025 | $1,000 | $97,100 | $21,500 | $75,600 |
| 2024 | -- | $97,100 | $21,500 | $75,600 |
| 2023 | $728 | $70,700 | $16,600 | $54,100 |
| 2022 | $728 | $70,700 | $16,600 | $54,100 |
| 2021 | $535 | $51,900 | $15,000 | $36,900 |
| 2020 | $269 | $51,900 | $15,000 | $36,900 |
| 2019 | $269 | $27,200 | $15,000 | $12,200 |
| 2018 | $269 | $27,200 | $15,000 | $12,200 |
| 2017 | $608 | $61,400 | $18,200 | $43,200 |
| 2016 | $608 | $61,400 | $18,200 | $43,200 |
| 2015 | -- | $0 | $0 | $0 |
| 2014 | -- | $0 | $0 | $0 |
| 2013 | -- | $0 | $0 | $0 |
Source: Public Records
Map
Nearby Homes
Your Personal Tour Guide
Ask me questions while you tour the home.