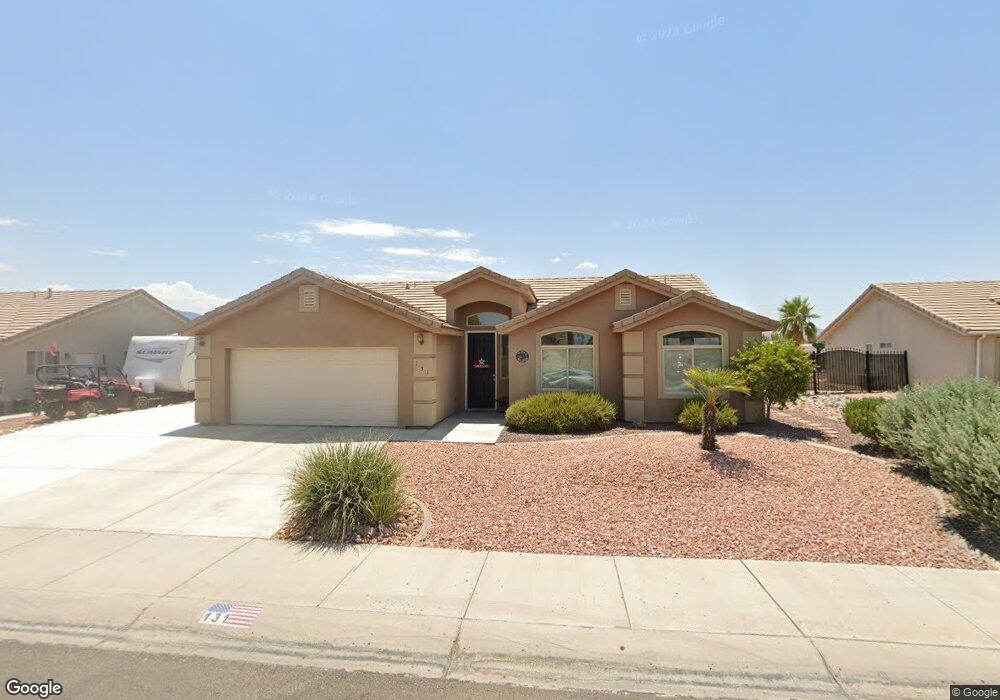
131 Burns Ln Mesquite, NV 89027
Estimated Value: $364,029 - $405,000
3
Beds
2
Baths
1,506
Sq Ft
$252/Sq Ft
Est. Value
About This Home
This home is located at 131 Burns Ln, Mesquite, NV 89027 and is currently estimated at $379,257, approximately $251 per square foot. 131 Burns Ln is a home located in Clark County with nearby schools including Virgin Valley Elementary School, Charles Arthur Hughes Middle School, and Virgin Valley High School.
Ownership History
Date
Name
Owned For
Owner Type
Purchase Details
Closed on
Jan 30, 2013
Sold by
Larson Timothy P
Bought by
Larson Susanne R
Current Estimated Value
Purchase Details
Closed on
Jun 7, 2010
Sold by
Larson Susanne R
Bought by
Larson Timothy P and Larson Susanne R
Purchase Details
Closed on
May 4, 2010
Sold by
Lasalle Bank Na
Bought by
Larson Susanne R
Purchase Details
Closed on
Jan 19, 2010
Sold by
Kovacs James Sandor and Kovacs Hope Combs
Bought by
Lasalle Bank Na
Purchase Details
Closed on
Dec 29, 2004
Sold by
Bact Lp
Bought by
Kovacs James Sandor and Kovacs Hope Combs
Home Financials for this Owner
Home Financials are based on the most recent Mortgage that was taken out on this home.
Original Mortgage
$148,320
Interest Rate
6.42%
Mortgage Type
Unknown
Purchase Details
Closed on
May 12, 2004
Sold by
D T Development Inc
Bought by
Bact Lp
Create a Home Valuation Report for This Property
The Home Valuation Report is an in-depth analysis detailing your home's value as well as a comparison with similar homes in the area
Home Values in the Area
Average Home Value in this Area
Purchase History
| Date | Buyer | Sale Price | Title Company |
|---|---|---|---|
| Larson Susanne R | -- | None Available | |
| Larson Timothy | -- | None Available | |
| Larson Timothy P | $217,814 | None Available | |
| Larson Susanne R | $142,590 | Fidelity Rainbow | |
| Lasalle Bank Na | $129,170 | Accommodation | |
| Kovacs James Sandor | $185,400 | Lawyers Title Of Nevada | |
| Bact Lp | $54,900 | Lawyers Title Of Nevada |
Source: Public Records
Mortgage History
| Date | Status | Borrower | Loan Amount |
|---|---|---|---|
| Previous Owner | Kovacs James Sandor | $148,320 | |
| Closed | Kovacs James Sandor | $37,080 |
Source: Public Records
Tax History Compared to Growth
Tax History
| Year | Tax Paid | Tax Assessment Tax Assessment Total Assessment is a certain percentage of the fair market value that is determined by local assessors to be the total taxable value of land and additions on the property. | Land | Improvement |
|---|---|---|---|---|
| 2025 | $1,650 | $103,089 | $29,750 | $73,339 |
| 2024 | $1,603 | $103,089 | $29,750 | $73,339 |
| 2023 | $1,603 | $95,234 | $26,250 | $68,984 |
| 2022 | $1,556 | $85,758 | $22,750 | $63,008 |
| 2021 | $1,511 | $78,706 | $18,900 | $59,806 |
| 2020 | $1,465 | $75,286 | $16,100 | $59,186 |
| 2019 | $1,422 | $74,468 | $16,100 | $58,368 |
| 2018 | $1,381 | $68,839 | $16,100 | $52,739 |
| 2017 | $1,672 | $60,295 | $12,600 | $47,695 |
| 2016 | $1,307 | $55,670 | $11,550 | $44,120 |
| 2015 | $1,304 | $50,584 | $8,750 | $41,834 |
| 2014 | $1,266 | $46,454 | $8,750 | $37,704 |
Source: Public Records
Map
Nearby Homes
- 251 Woodbury Ln
- 517 W Mesquite Blvd
- 262 Thistle St
- 581 Emperor Ln Unit 1
- 777 2nd St S
- 254 Reber Dr
- 228 Hiawatha Way
- 271 Concord Dr
- 433 Canyon Dr
- 260 Haley Way Unit 130
- 154 Emily Way
- 518 Plateau Rd
- 334 Colleen Ct Unit D
- Graham Plan at The Fields
- Beckett Plan at The Fields
- Weston Plan at The Fields
- 871 Falcon Glenn Dr
- 730 Hardy Way Unit A
- 744 Pinnacle Ct
- Plan - 01 at New Horizon at Falcon Ridge - New Horizon