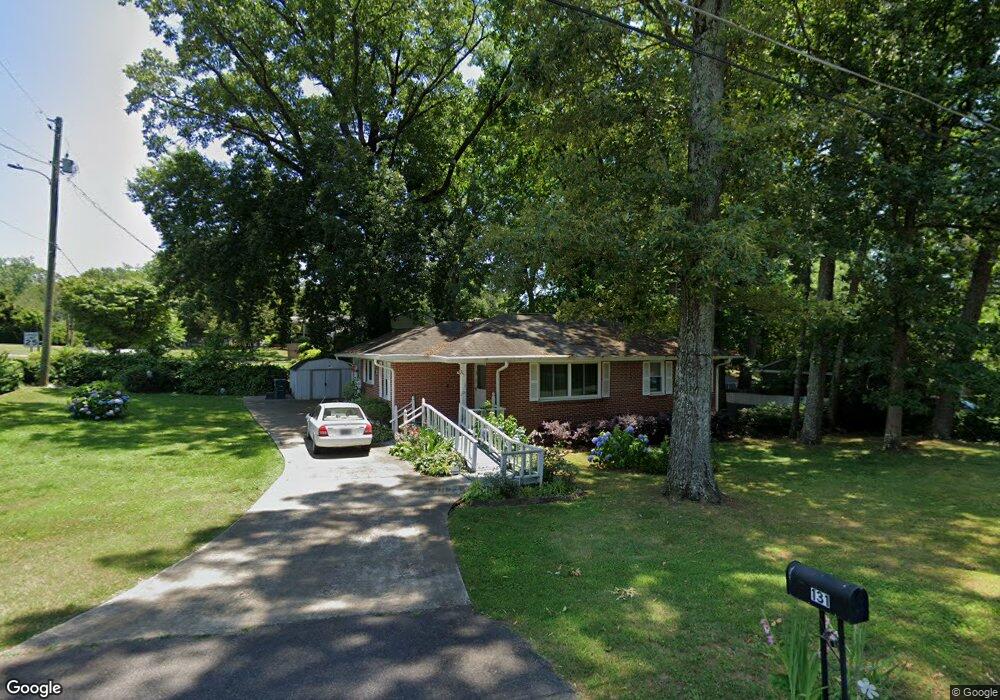
131 Charles Ave SE Marietta, GA 30067
Eastern Marietta NeighborhoodEstimated Value: $270,000 - $298,000
2
Beds
1
Bath
1,090
Sq Ft
$259/Sq Ft
Est. Value
About This Home
This home is located at 131 Charles Ave SE, Marietta, GA 30067 and is currently estimated at $282,030, approximately $258 per square foot. 131 Charles Ave SE is a home located in Cobb County with nearby schools including Marietta Sixth Grade Academy, Lockheed Elementary School, and Marietta Middle School.
Ownership History
Date
Name
Owned For
Owner Type
Purchase Details
Closed on
Jun 15, 2011
Sold by
Oberg Elvin E
Bought by
Watson-Byass Wilhemina P
Current Estimated Value
Home Financials for this Owner
Home Financials are based on the most recent Mortgage that was taken out on this home.
Original Mortgage
$72,124
Outstanding Balance
$50,100
Interest Rate
4.87%
Mortgage Type
FHA
Estimated Equity
$231,930
Purchase Details
Closed on
May 18, 2005
Sold by
Lewis Timothy M and Lewis Kathryn
Bought by
Oberg Elvin E
Home Financials for this Owner
Home Financials are based on the most recent Mortgage that was taken out on this home.
Original Mortgage
$65,000
Interest Rate
5.88%
Mortgage Type
New Conventional
Purchase Details
Closed on
Sep 16, 2003
Sold by
Johnson Betty S F
Bought by
Lewis Kathryn
Home Financials for this Owner
Home Financials are based on the most recent Mortgage that was taken out on this home.
Original Mortgage
$107,500
Interest Rate
6.33%
Mortgage Type
New Conventional
Purchase Details
Closed on
Jun 30, 2001
Sold by
Johnson Beecher
Bought by
Johnson Betty S
Create a Home Valuation Report for This Property
The Home Valuation Report is an in-depth analysis detailing your home's value as well as a comparison with similar homes in the area
Home Values in the Area
Average Home Value in this Area
Purchase History
| Date | Buyer | Sale Price | Title Company |
|---|---|---|---|
| Watson-Byass Wilhemina P | $74,000 | -- | |
| Oberg Elvin E | $115,500 | -- | |
| Lewis Kathryn | $107,500 | -- | |
| Johnson Betty S | -- | -- |
Source: Public Records
Mortgage History
| Date | Status | Borrower | Loan Amount |
|---|---|---|---|
| Open | Watson-Byass Wilhemina P | $72,124 | |
| Previous Owner | Oberg Elvin E | $65,000 | |
| Previous Owner | Lewis Kathryn | $107,500 |
Source: Public Records
Tax History Compared to Growth
Tax History
| Year | Tax Paid | Tax Assessment Tax Assessment Total Assessment is a certain percentage of the fair market value that is determined by local assessors to be the total taxable value of land and additions on the property. | Land | Improvement |
|---|---|---|---|---|
| 2025 | $365 | $105,828 | $40,000 | $65,828 |
| 2024 | $365 | $105,828 | $40,000 | $65,828 |
| 2023 | $213 | $91,108 | $27,000 | $64,108 |
| 2022 | $365 | $77,800 | $27,000 | $50,800 |
| 2021 | $374 | $65,772 | $27,000 | $38,772 |
| 2020 | $457 | $53,188 | $17,000 | $36,188 |
| 2019 | $397 | $46,172 | $12,000 | $34,172 |
| 2018 | $397 | $46,172 | $12,000 | $34,172 |
| 2017 | $248 | $36,012 | $8,000 | $28,012 |
| 2016 | $248 | $36,012 | $8,000 | $28,012 |
| 2015 | $215 | $28,632 | $6,000 | $22,632 |
| 2014 | $181 | $23,416 | $0 | $0 |
Source: Public Records
Map
Nearby Homes
- 229 Mathews Cir SE
- 141 Powers Ferry Rd SE
- 185 Herbert Dr SE
- 1664 Crestridge Dr SE
- 1722 Crestridge Dr SE
- 1785 Crestridge Dr SE
- 1445 Varner Rd
- 1824 Crestridge Dr SE
- 340 Bell St SE
- 503 Sonata Walk
- 0 Shadowbrook Dr Unit 10506866
- 0 Shadowbrook Dr Unit 7564152
- 332 Hamilton Trace
- 378 Lockheed Ave SE
- 349 Virginia Place SE
- 369 Virginia Place SE
- 1849 Toccata Ln
- 432 Williamson St SE Unit 843
- 306 Augusta Dr SE
- 0 Charles Ave SE Unit 3285241
- 0 Charles Ave SE Unit 8455889
- 0 Charles Ave SE Unit 8417228
- 0 Charles Ave SE Unit 8411447
- 0 Charles Ave SE Unit 8304173
- 0 Charles Ave SE Unit 8283391
- 0 Charles Ave SE Unit 8257552
- 0 Charles Ave SE Unit 7636239
- 0 Charles Ave SE Unit 8380351
- 0 Charles Ave SE Unit 8337924
- 0 Charles Ave SE Unit 3194295
- 0 Charles Ave SE Unit 3215971
- 145 Charles Ave SE
- 115 Charles Ave SE
- 155 Charles Ave SE
- 146 Mathews Cir SE
- 1445 James St SE
- 124 Charles Ave SE
- 138 Charles Ave SE
- 160 Mathews Cir SE