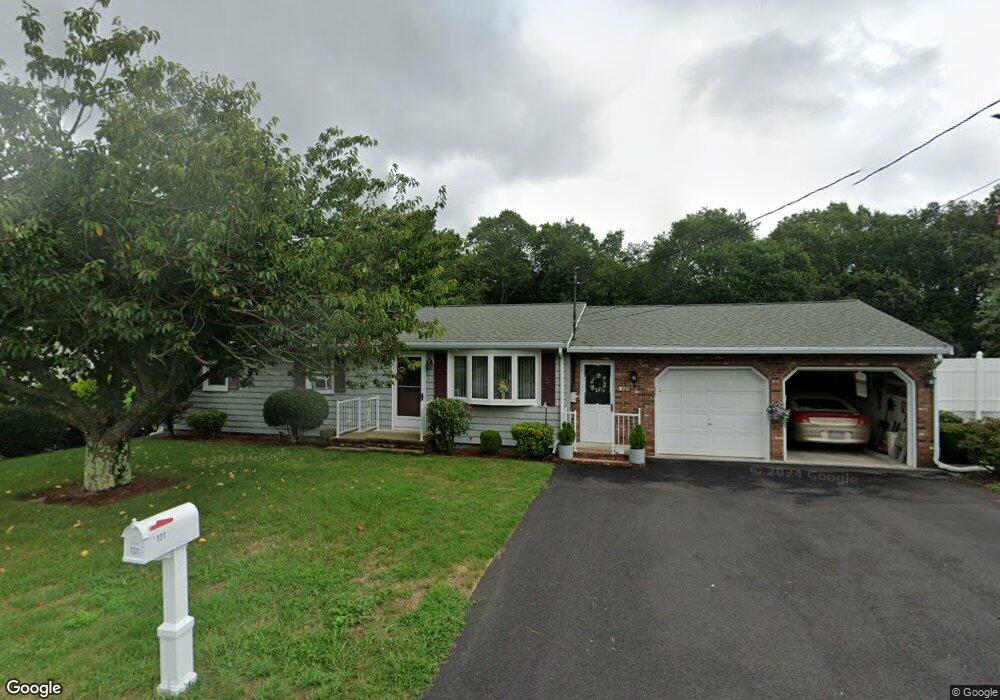
131 Davis Rd Westport, MA 02790
North Westport NeighborhoodEstimated Value: $463,170 - $535,000
3
Beds
--
Bath
1,092
Sq Ft
$454/Sq Ft
Est. Value
About This Home
This home is located at 131 Davis Rd, Westport, MA 02790 and is currently estimated at $495,293, approximately $453 per square foot. 131 Davis Rd is a home located in Bristol County with nearby schools including Alice A. Macomber Primary School, Westport Elementary School, and Westport Middle-High School.
Ownership History
Date
Name
Owned For
Owner Type
Purchase Details
Closed on
Jan 25, 2019
Sold by
Nunes Darren R
Bought by
Bernier Lisa and Nunes Glenn R
Current Estimated Value
Purchase Details
Closed on
May 16, 2014
Sold by
Nunes Edmond R and Nunes Collette L
Bought by
Nunes Darren R and Nunes Glenn R
Purchase Details
Closed on
Mar 28, 1967
Bought by
Nunes Edmond R and Nunes Collette L
Create a Home Valuation Report for This Property
The Home Valuation Report is an in-depth analysis detailing your home's value as well as a comparison with similar homes in the area
Home Values in the Area
Average Home Value in this Area
Purchase History
| Date | Buyer | Sale Price | Title Company |
|---|---|---|---|
| Bernier Lisa | -- | -- | |
| Nunes Darren R | -- | -- | |
| Nunes Edmond R | -- | -- |
Source: Public Records
Mortgage History
| Date | Status | Borrower | Loan Amount |
|---|---|---|---|
| Previous Owner | Nunes Edmond R | $15,000 | |
| Previous Owner | Nunes Edmond R | $30,400 | |
| Previous Owner | Nunes Edmond R | $10,000 | |
| Previous Owner | Nunes Edmond R | $10,000 |
Source: Public Records
Tax History Compared to Growth
Tax History
| Year | Tax Paid | Tax Assessment Tax Assessment Total Assessment is a certain percentage of the fair market value that is determined by local assessors to be the total taxable value of land and additions on the property. | Land | Improvement |
|---|---|---|---|---|
| 2025 | $3,021 | $405,500 | $168,800 | $236,700 |
| 2024 | $2,964 | $383,500 | $149,900 | $233,600 |
| 2023 | $2,864 | $351,000 | $136,600 | $214,400 |
| 2022 | $2,581 | $304,400 | $136,600 | $167,800 |
| 2021 | $2,420 | $280,700 | $112,900 | $167,800 |
| 2020 | $2,328 | $276,200 | $108,400 | $167,800 |
| 2019 | $2,281 | $275,800 | $108,400 | $167,400 |
| 2018 | $2,173 | $266,000 | $116,600 | $149,400 |
| 2017 | $2,096 | $263,000 | $116,600 | $146,400 |
| 2016 | $1,974 | $249,600 | $116,600 | $133,000 |
| 2015 | $1,865 | $235,200 | $116,600 | $118,600 |
Source: Public Records
Map
Nearby Homes