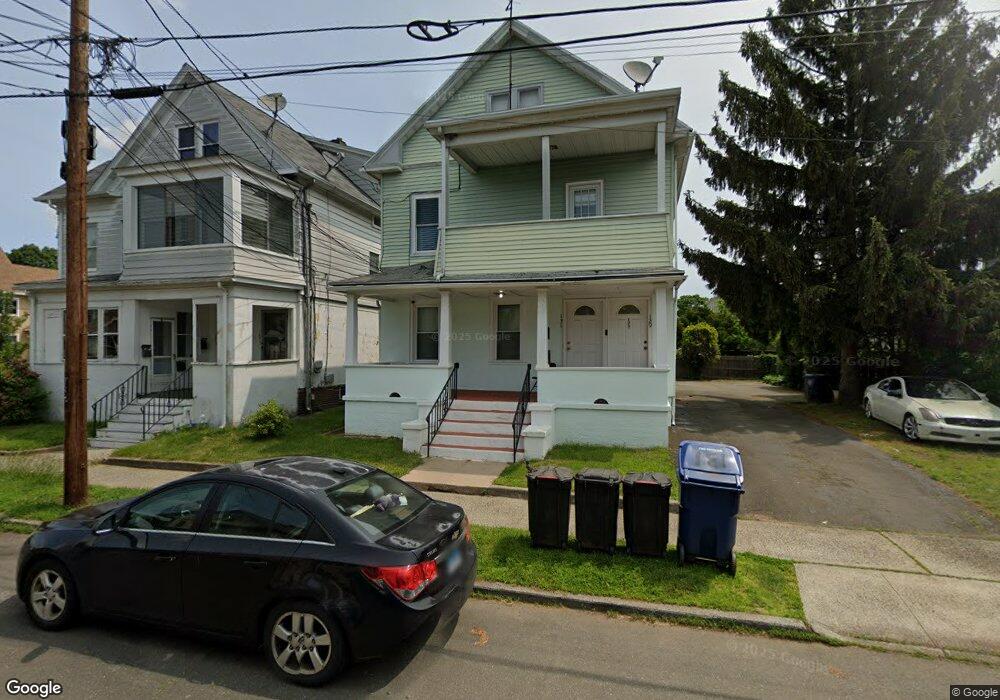
131 East Ave West Haven, CT 06516
West Haven Center NeighborhoodEstimated Value: $407,253 - $483,000
6
Beds
2
Baths
2,324
Sq Ft
$189/Sq Ft
Est. Value
About This Home
This home is located at 131 East Ave, West Haven, CT 06516 and is currently estimated at $440,313, approximately $189 per square foot. 131 East Ave is a home located in New Haven County with nearby schools including Carrigan 5/6 Intermediate School, Harry M. Bailey Middle School, and West Haven High School.
Ownership History
Date
Name
Owned For
Owner Type
Purchase Details
Closed on
Aug 11, 2009
Sold by
Ramirez Ramon
Bought by
Cameros Edgar
Current Estimated Value
Home Financials for this Owner
Home Financials are based on the most recent Mortgage that was taken out on this home.
Original Mortgage
$250,361
Interest Rate
5.47%
Mortgage Type
Purchase Money Mortgage
Purchase Details
Closed on
Nov 5, 2008
Sold by
Ramos Yesid
Bought by
Ramirez Ramon
Purchase Details
Closed on
Dec 22, 2006
Sold by
Lasalle Bk Na
Bought by
Ramos Yesid
Purchase Details
Closed on
Jan 9, 2004
Sold by
Bfb Prop Llc
Bought by
Fernandez Armando and Fernandez Eliana
Purchase Details
Closed on
Mar 6, 2000
Sold by
Franklin Credit Mgmt
Bought by
Banning Brian F
Create a Home Valuation Report for This Property
The Home Valuation Report is an in-depth analysis detailing your home's value as well as a comparison with similar homes in the area
Home Values in the Area
Average Home Value in this Area
Purchase History
| Date | Buyer | Sale Price | Title Company |
|---|---|---|---|
| Cameros Edgar | $255,000 | -- | |
| Cameros Edgar | $255,000 | -- | |
| Ramirez Ramon | $140,000 | -- | |
| Ramirez Ramon | $140,000 | -- | |
| Ramos Yesid | $243,000 | -- | |
| Ramos Yesid | $243,000 | -- | |
| Fernandez Armando | $230,000 | -- | |
| Fernandez Armando | $230,000 | -- | |
| Banning Brian F | $71,000 | -- |
Source: Public Records
Mortgage History
| Date | Status | Borrower | Loan Amount |
|---|---|---|---|
| Open | Banning Brian F | $250,381 | |
| Closed | Banning Brian F | $250,361 |
Source: Public Records
Tax History Compared to Growth
Tax History
| Year | Tax Paid | Tax Assessment Tax Assessment Total Assessment is a certain percentage of the fair market value that is determined by local assessors to be the total taxable value of land and additions on the property. | Land | Improvement |
|---|---|---|---|---|
| 2025 | $8,718 | $252,490 | $59,850 | $192,640 |
| 2024 | $8,240 | $169,820 | $41,440 | $128,380 |
| 2023 | $7,898 | $169,820 | $41,440 | $128,380 |
| 2022 | $7,744 | $169,820 | $41,440 | $128,380 |
| 2021 | $7,603 | $169,820 | $41,440 | $128,380 |
| 2020 | $7,359 | $145,810 | $33,390 | $112,420 |
| 2019 | $7,097 | $145,810 | $33,390 | $112,420 |
| 2018 | $7,035 | $145,810 | $33,390 | $112,420 |
| 2017 | $6,658 | $145,810 | $33,390 | $112,420 |
| 2016 | $6,643 | $145,810 | $33,390 | $112,420 |
| 2015 | $6,892 | $170,800 | $37,170 | $133,630 |
| 2014 | $6,849 | $170,800 | $37,170 | $133,630 |
Source: Public Records
Map
Nearby Homes
- 34 Thomas St
- 88 William St
- 94 Thomas St
- 12 East Ave
- 1 Peck Ave Unit 11
- 90 Blohm St
- 140 Captain Thomas Blvd Unit 302
- 189 Park St
- 72 Atwater St
- 142 West Walk Unit 142
- 202 Campbell Ave
- 31 West Walk Unit 31
- 19 Marion St
- 65 West Walk
- 341 Peck Ave
- 79 May St
- 159 Leete St
- 82 Jones St
- 102 Brown St
- 314 Park St