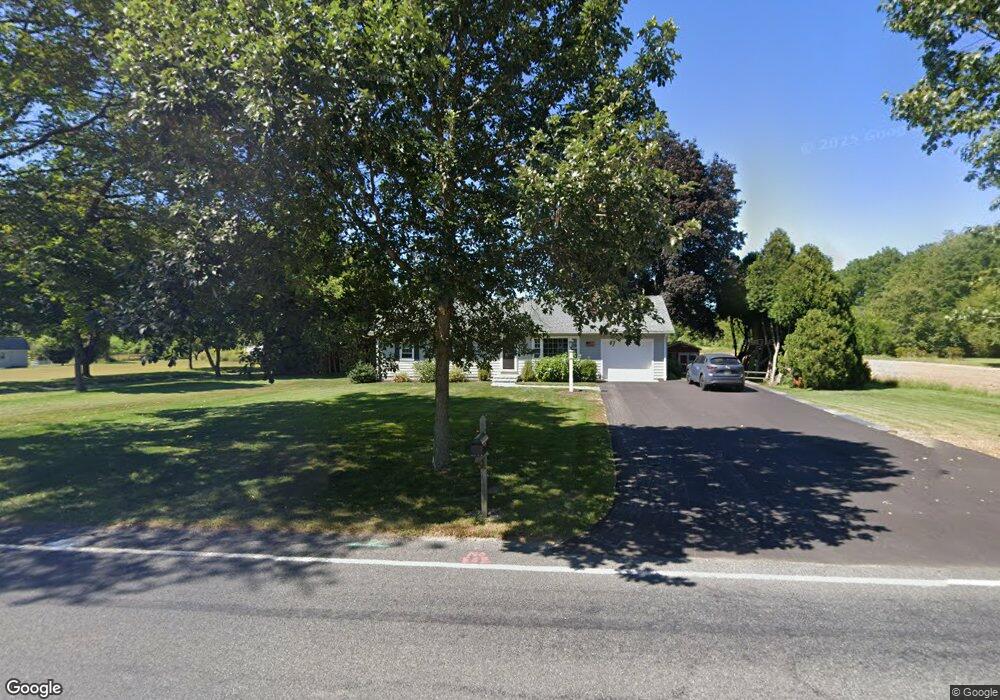
131 East St Hadley, MA 01035
Estimated Value: $408,011 - $528,000
3
Beds
1
Bath
1,176
Sq Ft
$397/Sq Ft
Est. Value
About This Home
This home is located at 131 East St, Hadley, MA 01035 and is currently estimated at $466,753, approximately $396 per square foot. 131 East St is a home located in Hampshire County with nearby schools including Hadley Elementary School, Hopkins Academy, and Pioneer Valley Chinese Immersion Charter School.
Ownership History
Date
Name
Owned For
Owner Type
Purchase Details
Closed on
Sep 19, 2018
Sold by
Bakaj John A
Bought by
Prajzner Katherine M and Prajzner Edward J
Current Estimated Value
Home Financials for this Owner
Home Financials are based on the most recent Mortgage that was taken out on this home.
Original Mortgage
$242,000
Outstanding Balance
$210,604
Interest Rate
4.5%
Mortgage Type
New Conventional
Estimated Equity
$256,149
Create a Home Valuation Report for This Property
The Home Valuation Report is an in-depth analysis detailing your home's value as well as a comparison with similar homes in the area
Home Values in the Area
Average Home Value in this Area
Purchase History
| Date | Buyer | Sale Price | Title Company |
|---|---|---|---|
| Prajzner Katherine M | $302,500 | -- |
Source: Public Records
Mortgage History
| Date | Status | Borrower | Loan Amount |
|---|---|---|---|
| Open | Prajzner Katherine M | $242,000 |
Source: Public Records
Tax History
| Year | Tax Paid | Tax Assessment Tax Assessment Total Assessment is a certain percentage of the fair market value that is determined by local assessors to be the total taxable value of land and additions on the property. | Land | Improvement |
|---|---|---|---|---|
| 2025 | $3,591 | $308,800 | $110,700 | $198,100 |
| 2024 | $3,416 | $299,900 | $110,700 | $189,200 |
| 2023 | $3,282 | $284,400 | $110,700 | $173,700 |
| 2022 | $3,058 | $251,100 | $110,700 | $140,400 |
| 2021 | $2,824 | $235,300 | $110,700 | $124,600 |
| 2020 | $2,835 | $221,800 | $110,700 | $111,100 |
| 2019 | $2,741 | $221,800 | $110,700 | $111,100 |
| 2018 | $2,682 | $221,800 | $110,700 | $111,100 |
| 2017 | $2,567 | $221,900 | $110,700 | $111,200 |
| 2016 | $2,474 | $221,900 | $110,700 | $111,200 |
| 2015 | $2,410 | $221,900 | $110,700 | $111,200 |
| 2014 | $2,361 | $221,900 | $110,700 | $111,200 |
Source: Public Records
Map
Nearby Homes
- 133 Middle St
- 83 Bay Rd
- 11 West St
- 0 N Branch Rd
- 26 Russell St Unit A-B
- 35 Hubbard Ave
- 132 Pondview Dr
- 22 Woodbine Ave
- 18 Elm St
- 51 Phillips Place Unit 1
- 20 View Ave Unit A
- 30 View Ave
- 58 Main St Unit 4
- 58 Main St Unit 3
- 10 Hawley St Unit 4C
- 10 Hawley St Unit 4D
- 10 Hawley St Unit 1C
- 10 Hawley St Unit 4B
- 10 Hawley St Unit 4A
- 23 Eastern Ave
Your Personal Tour Guide
Ask me questions while you tour the home.