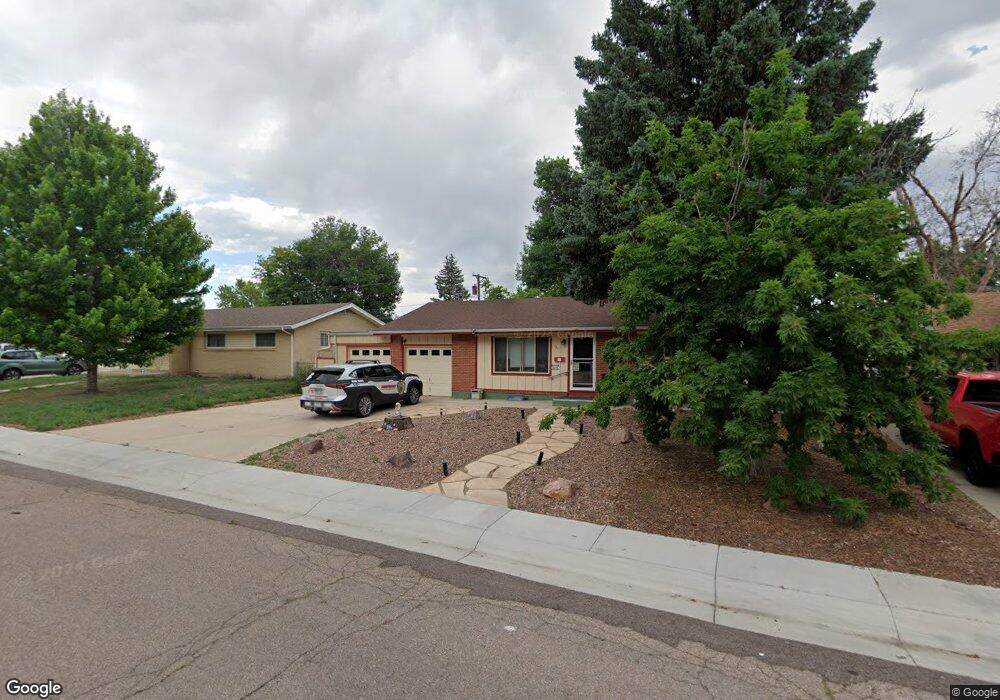
131 Ely St Colorado Springs, CO 80911
Widefield NeighborhoodEstimated Value: $330,000 - $362,000
3
Beds
2
Baths
897
Sq Ft
$389/Sq Ft
Est. Value
About This Home
This home is located at 131 Ely St, Colorado Springs, CO 80911 and is currently estimated at $349,173, approximately $389 per square foot. 131 Ely St is a home located in El Paso County with nearby schools including Talbott STEAM Innovation School, Watson Junior High School, and Mesa Ridge High School.
Ownership History
Date
Name
Owned For
Owner Type
Purchase Details
Closed on
Jun 26, 2015
Sold by
The Max Monte Patterson Irrevocable Gran
Bought by
Yates Dale Wayne
Current Estimated Value
Home Financials for this Owner
Home Financials are based on the most recent Mortgage that was taken out on this home.
Original Mortgage
$165,176
Outstanding Balance
$129,019
Interest Rate
3.91%
Mortgage Type
VA
Estimated Equity
$220,154
Purchase Details
Closed on
Jun 11, 1996
Sold by
Jean Patterson Norma
Bought by
Patterson Max Monte
Home Financials for this Owner
Home Financials are based on the most recent Mortgage that was taken out on this home.
Original Mortgage
$30,000
Interest Rate
7.92%
Create a Home Valuation Report for This Property
The Home Valuation Report is an in-depth analysis detailing your home's value as well as a comparison with similar homes in the area
Home Values in the Area
Average Home Value in this Area
Purchase History
| Date | Buyer | Sale Price | Title Company |
|---|---|---|---|
| Yates Dale Wayne | $159,900 | Unified Title Co Inc | |
| Patterson Max Monte | -- | Land Title |
Source: Public Records
Mortgage History
| Date | Status | Borrower | Loan Amount |
|---|---|---|---|
| Open | Yates Dale Wayne | $165,176 | |
| Previous Owner | Patterson Max Monte | $30,000 |
Source: Public Records
Tax History Compared to Growth
Tax History
| Year | Tax Paid | Tax Assessment Tax Assessment Total Assessment is a certain percentage of the fair market value that is determined by local assessors to be the total taxable value of land and additions on the property. | Land | Improvement |
|---|---|---|---|---|
| 2025 | $1,512 | $24,420 | -- | -- |
| 2024 | $1,453 | $25,350 | $4,820 | $20,530 |
| 2023 | $1,453 | $25,350 | $4,820 | $20,530 |
| 2022 | $1,288 | $18,480 | $3,410 | $15,070 |
| 2021 | $1,393 | $19,000 | $3,500 | $15,500 |
| 2020 | $1,061 | $14,190 | $3,070 | $11,120 |
| 2019 | $1,055 | $14,190 | $3,070 | $11,120 |
| 2018 | $950 | $11,980 | $2,340 | $9,640 |
| 2017 | $961 | $11,980 | $2,340 | $9,640 |
| 2016 | $729 | $11,300 | $2,390 | $8,910 |
| 2015 | $375 | $11,300 | $2,390 | $8,910 |
| 2014 | $354 | $10,780 | $2,390 | $8,390 |
Source: Public Records
Map
Nearby Homes