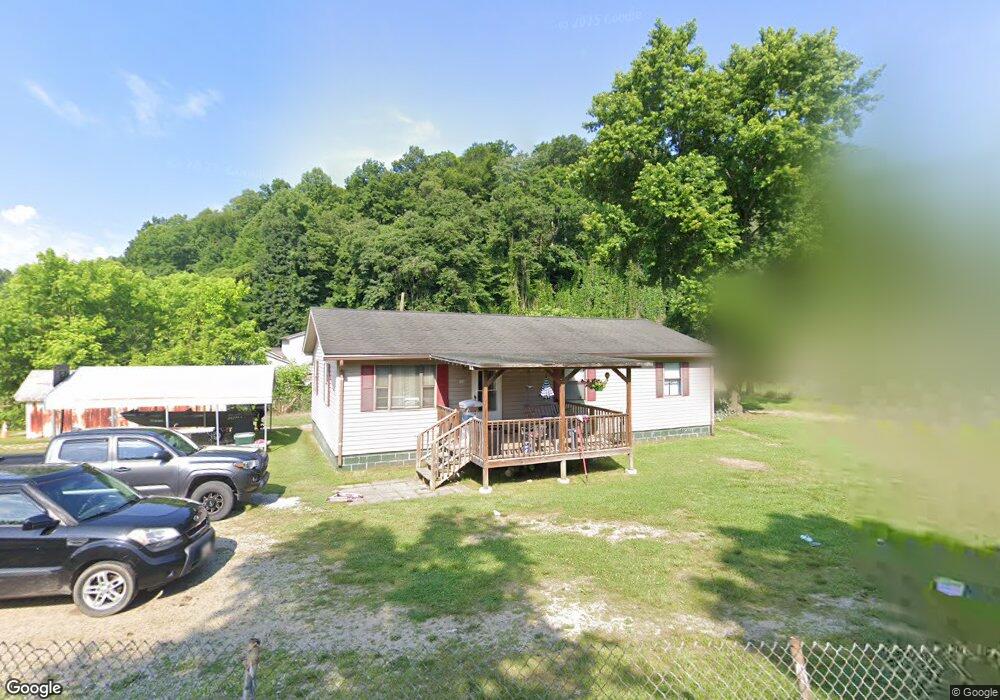
131 Fox Branch Rd Clairfield, TN 37715
Estimated Value: $80,729 - $116,000
Studio
1
Bath
1,232
Sq Ft
$84/Sq Ft
Est. Value
About This Home
This home is located at 131 Fox Branch Rd, Clairfield, TN 37715 and is currently estimated at $103,682, approximately $84 per square foot. 131 Fox Branch Rd is a home located in Claiborne County.
Ownership History
Date
Name
Owned For
Owner Type
Purchase Details
Closed on
Jul 26, 2016
Sold by
Michael Andy E
Bought by
Miller James T and Miller Amy
Current Estimated Value
Home Financials for this Owner
Home Financials are based on the most recent Mortgage that was taken out on this home.
Original Mortgage
$49,953
Outstanding Balance
$39,531
Interest Rate
3.48%
Mortgage Type
New Conventional
Estimated Equity
$64,151
Purchase Details
Closed on
Apr 21, 2003
Sold by
Partin Roland
Bought by
Michael Andy E
Home Financials for this Owner
Home Financials are based on the most recent Mortgage that was taken out on this home.
Original Mortgage
$35,600
Interest Rate
5.6%
Purchase Details
Closed on
Sep 11, 1998
Bought by
Partin Roland and Partin Darlene
Purchase Details
Closed on
Jan 2, 1981
Bought by
Partin Roland and Wife Darlene
Purchase Details
Closed on
Jan 1, 1977
Purchase Details
Closed on
Jan 1, 1975
Purchase Details
Closed on
Jan 3, 1962
Create a Home Valuation Report for This Property
The Home Valuation Report is an in-depth analysis detailing your home's value as well as a comparison with similar homes in the area
Purchase History
| Date | Buyer | Sale Price | Title Company |
|---|---|---|---|
| Miller James T | $45,000 | -- | |
| Michael Andy E | $40,000 | -- | |
| Partin Roland | $500 | -- | |
| Partin Roland | -- | -- | |
| -- | -- | -- | |
| -- | -- | -- | |
| -- | -- | -- |
Source: Public Records
Mortgage History
| Date | Status | Borrower | Loan Amount |
|---|---|---|---|
| Open | Miller James T | $49,953 | |
| Previous Owner | Not Available | $35,600 |
Source: Public Records
Tax History
| Year | Tax Paid | Tax Assessment Tax Assessment Total Assessment is a certain percentage of the fair market value that is determined by local assessors to be the total taxable value of land and additions on the property. | Land | Improvement |
|---|---|---|---|---|
| 2025 | $267 | $11,425 | $425 | $11,000 |
| 2024 | $267 | $11,425 | $425 | $11,000 |
| 2023 | $267 | $11,425 | $425 | $11,000 |
| 2022 | $229 | $11,425 | $425 | $11,000 |
| 2021 | $312 | $12,100 | $400 | $11,700 |
| 2020 | $312 | $12,100 | $400 | $11,700 |
| 2019 | $312 | $12,100 | $400 | $11,700 |
| 2018 | $312 | $12,100 | $400 | $11,700 |
| 2017 | $312 | $12,100 | $400 | $11,700 |
| 2016 | $359 | $13,925 | $400 | $13,525 |
| 2015 | $345 | $13,925 | $400 | $13,525 |
| 2014 | $345 | $13,935 | $0 | $0 |
Source: Public Records
Map
Nearby Homes
- 135 Midway Rd
- 444 Roses Creek Rd
- 122 Blue Hollow Rd
- 0 Tennessee 90
- 175 John Partin Rd
- 01 White Oak Rd
- 4601 White Oak Rd
- 2719 Westbourne Rd
- 0 Westbourne Rd Unit LotWP002 21369128
- 0 Westbourne Rd Unit 1327842
- 02 Westbourne Rd
- 0 Little White Oak Rd
- 1410 Tn-90
- 15379 State Highway 190
- 5441 White Oak Rd
- 217 Saw Mill Ln
- 603 Sled Creek Rd
- 01 Chadwell Hollow Rd
- 0 Sled Creek Rd
- 461 Round Ridge Rd
- 143 Fox Branch Rd
- 107 Fox Ln
- 172 Webb Ln
- 113 Fox Ln
- 6149 Highway 90
- 156 Fox Branch Rd
- 121 Fox Ln
- 6153 Highway 90
- 177 Fox Branch Rd
- 118 Bowman Dr
- 6193 Highway 90
- 6221 Highway 90
- 164 Fox Branch Rd
- 129 Fox Ln
- 6127 Highway 90
- 6127 Highway 90
- 6213 Highway 90
- 180 Fox Branch Rd
- 6180 Highway 90
- 6176 Highway 90
Your Personal Tour Guide
Ask me questions while you tour the home.