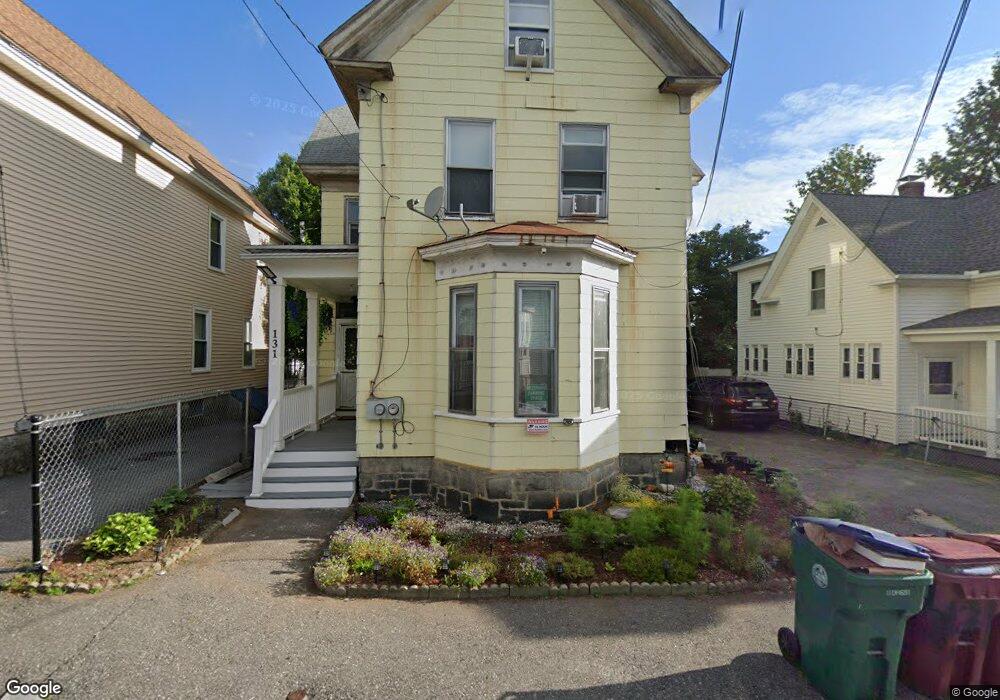
131 Grove St Unit 2 Lowell, MA 01851
Highlands NeighborhoodEstimated Value: $488,000 - $515,000
1
Bed
1
Bath
500
Sq Ft
$1,003/Sq Ft
Est. Value
About This Home
This home is located at 131 Grove St Unit 2, Lowell, MA 01851 and is currently estimated at $501,519, approximately $1,003 per square foot. 131 Grove St Unit 2 is a home located in Middlesex County with nearby schools including Charles W. Morey Elementary School, Abraham Lincoln Elementary School, and Dr. Gertrude Bailey Elementary School.
Ownership History
Date
Name
Owned For
Owner Type
Purchase Details
Closed on
Dec 8, 2023
Sold by
Georgoulis Ft and Georgoulis
Bought by
Siv Lang and San Leangsiv
Current Estimated Value
Home Financials for this Owner
Home Financials are based on the most recent Mortgage that was taken out on this home.
Original Mortgage
$418,000
Outstanding Balance
$410,766
Interest Rate
7.79%
Mortgage Type
Purchase Money Mortgage
Estimated Equity
$90,753
Create a Home Valuation Report for This Property
The Home Valuation Report is an in-depth analysis detailing your home's value as well as a comparison with similar homes in the area
Home Values in the Area
Average Home Value in this Area
Purchase History
| Date | Buyer | Sale Price | Title Company |
|---|---|---|---|
| Siv Lang | $440,000 | None Available |
Source: Public Records
Mortgage History
| Date | Status | Borrower | Loan Amount |
|---|---|---|---|
| Open | Siv Lang | $418,000 |
Source: Public Records
Tax History Compared to Growth
Tax History
| Year | Tax Paid | Tax Assessment Tax Assessment Total Assessment is a certain percentage of the fair market value that is determined by local assessors to be the total taxable value of land and additions on the property. | Land | Improvement |
|---|---|---|---|---|
| 2025 | $5,143 | $448,000 | $132,000 | $316,000 |
| 2024 | $4,743 | $398,200 | $118,800 | $279,400 |
| 2023 | $4,403 | $354,500 | $103,300 | $251,200 |
| 2022 | $4,076 | $321,200 | $93,900 | $227,300 |
| 2021 | $3,780 | $280,800 | $81,700 | $199,100 |
| 2020 | $3,405 | $254,900 | $71,300 | $183,600 |
| 2019 | $3,257 | $232,000 | $66,100 | $165,900 |
| 2018 | $3,003 | $208,700 | $60,100 | $148,600 |
| 2017 | $2,838 | $190,200 | $54,600 | $135,600 |
| 2016 | $2,843 | $187,500 | $52,000 | $135,500 |
| 2015 | $2,653 | $171,400 | $53,200 | $118,200 |
| 2013 | $2,465 | $164,200 | $63,700 | $100,500 |
Source: Public Records
Map
Nearby Homes