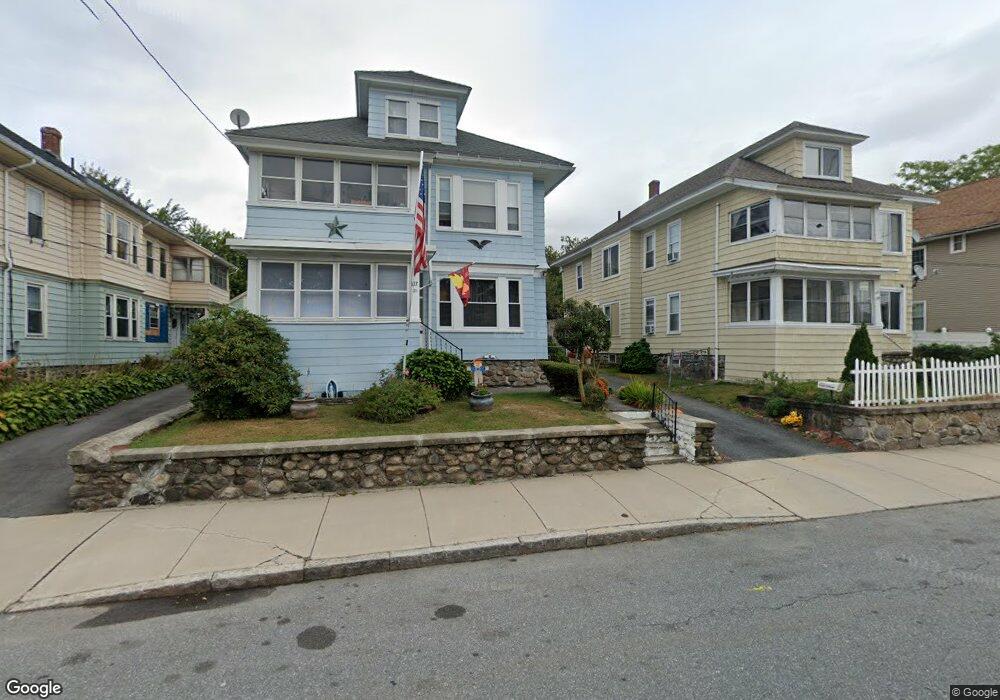
131 High St Unit 133 Lawrence, MA 01841
Prospect Hill-Back Bay NeighborhoodEstimated Value: $682,573 - $851,000
6
Beds
2
Baths
2,648
Sq Ft
$285/Sq Ft
Est. Value
About This Home
This home is located at 131 High St Unit 133, Lawrence, MA 01841 and is currently estimated at $755,643, approximately $285 per square foot. 131 High St Unit 133 is a home located in Essex County with nearby schools including School For Exceptional Studies, Community Day Charter Public School - Gateway, and Esperanza Academy School of Hope.
Ownership History
Date
Name
Owned For
Owner Type
Purchase Details
Closed on
Nov 23, 2018
Sold by
Gill Fatima Est
Bought by
Johnson Natalie G and Melo-Johnson Natalie
Current Estimated Value
Purchase Details
Closed on
Apr 7, 2005
Sold by
Melo Fatima G and Gill Fatima G
Bought by
Gill Fatima G
Home Financials for this Owner
Home Financials are based on the most recent Mortgage that was taken out on this home.
Original Mortgage
$148,500
Interest Rate
5.66%
Mortgage Type
Purchase Money Mortgage
Purchase Details
Closed on
Mar 4, 2005
Sold by
Melo Fatima G
Bought by
Gill Fatima
Home Financials for this Owner
Home Financials are based on the most recent Mortgage that was taken out on this home.
Original Mortgage
$148,500
Interest Rate
5.66%
Mortgage Type
Purchase Money Mortgage
Create a Home Valuation Report for This Property
The Home Valuation Report is an in-depth analysis detailing your home's value as well as a comparison with similar homes in the area
Home Values in the Area
Average Home Value in this Area
Purchase History
| Date | Buyer | Sale Price | Title Company |
|---|---|---|---|
| Johnson Natalie G | -- | -- | |
| Gill Fatima G | -- | -- | |
| Gill Fatima | -- | -- |
Source: Public Records
Mortgage History
| Date | Status | Borrower | Loan Amount |
|---|---|---|---|
| Previous Owner | Gill Fatima | $148,500 |
Source: Public Records
Tax History
| Year | Tax Paid | Tax Assessment Tax Assessment Total Assessment is a certain percentage of the fair market value that is determined by local assessors to be the total taxable value of land and additions on the property. | Land | Improvement |
|---|---|---|---|---|
| 2025 | $5,452 | $619,600 | $137,100 | $482,500 |
| 2024 | $5,310 | $574,000 | $132,500 | $441,500 |
| 2023 | $5,017 | $493,800 | $114,200 | $379,600 |
| 2022 | $4,558 | $398,400 | $106,000 | $292,400 |
| 2021 | $4,479 | $365,000 | $106,000 | $259,000 |
| 2020 | $4,275 | $343,900 | $85,000 | $258,900 |
| 2019 | $4,352 | $318,100 | $87,900 | $230,200 |
| 2018 | $3,838 | $268,000 | $80,000 | $188,000 |
| 2017 | $3,886 | $253,300 | $79,100 | $174,200 |
| 2016 | $3,532 | $227,700 | $52,800 | $174,900 |
| 2015 | $3,320 | $219,600 | $52,800 | $166,800 |
Source: Public Records
Map
Nearby Homes
- 52 Howard St
- 7 Stevens Ct
- 27 Woodland Ct
- 32 Orchard St
- 2 Leslie St
- 89 Newbury St Unit 89B
- 192 Union St
- 94 Summer St
- 144 Ferry St
- 264 E Haverhill St Unit 2
- 106 Leroy Ave
- 11 Lawrence St Unit 606
- 4 Shawsheen Rd Unit 2
- 131A Lawrence St Unit 40
- 39 Swan Ave
- 46 Amesbury St Unit 2B
- 28 Patriot St
- 18 Erhardt Terrace
- 68 Union St
- 151-153 Bailey St
Your Personal Tour Guide
Ask me questions while you tour the home.