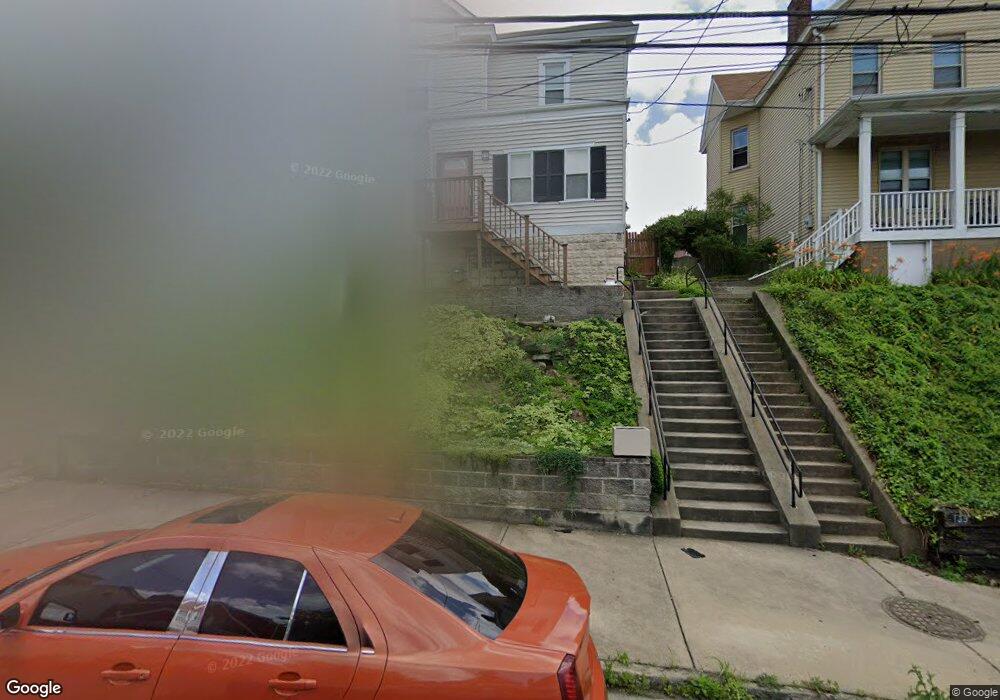
131 Labelle St Pittsburgh, PA 15211
Mount Washington NeighborhoodEstimated Value: $178,000 - $394,000
4
Beds
2
Baths
2,253
Sq Ft
$137/Sq Ft
Est. Value
About This Home
This home is located at 131 Labelle St, Pittsburgh, PA 15211 and is currently estimated at $308,173, approximately $136 per square foot. 131 Labelle St is a home located in Allegheny County with nearby schools including Pittsburgh Whittier K-5, South Hills Middle School, and Pittsburgh Brashear High School.
Ownership History
Date
Name
Owned For
Owner Type
Purchase Details
Closed on
Jan 12, 2016
Sold by
Jackson Allen M and Auth Jackson Joyce
Bought by
Jackson Allen M and Jackson Margaret J
Current Estimated Value
Home Financials for this Owner
Home Financials are based on the most recent Mortgage that was taken out on this home.
Original Mortgage
$98,188
Outstanding Balance
$78,497
Interest Rate
4.12%
Mortgage Type
FHA
Estimated Equity
$229,676
Purchase Details
Closed on
Aug 2, 2002
Sold by
Jackson Joyce Auth
Bought by
Jackson Allen M and Jackson Joyce Auth
Purchase Details
Closed on
Oct 27, 1997
Sold by
Schott Joyce Auth and Schott Michael
Bought by
Schott Joyce Auth
Purchase Details
Closed on
Aug 12, 1996
Sold by
Auth John and Auth Dorothy
Bought by
Schott Joyce Auth
Purchase Details
Closed on
Oct 12, 1995
Sold by
Auth John and Auth Thomas
Bought by
Auth John and Auth Dorothy
Purchase Details
Closed on
Sep 14, 1995
Sold by
Auth Gloria Jean and Auth Jr Edward Gerard
Bought by
Scholl Michael and Schott Allela
Create a Home Valuation Report for This Property
The Home Valuation Report is an in-depth analysis detailing your home's value as well as a comparison with similar homes in the area
Home Values in the Area
Average Home Value in this Area
Purchase History
| Date | Buyer | Sale Price | Title Company |
|---|---|---|---|
| Jackson Allen M | -- | None Available | |
| Jackson Allen M | -- | -- | |
| Schott Joyce Auth | -- | -- | |
| Schott Joyce Auth | -- | -- | |
| Schott Joyce Auth | -- | -- | |
| Auth John | -- | -- | |
| Scholl Michael | -- | -- |
Source: Public Records
Mortgage History
| Date | Status | Borrower | Loan Amount |
|---|---|---|---|
| Open | Jackson Allen M | $98,188 |
Source: Public Records
Tax History Compared to Growth
Tax History
| Year | Tax Paid | Tax Assessment Tax Assessment Total Assessment is a certain percentage of the fair market value that is determined by local assessors to be the total taxable value of land and additions on the property. | Land | Improvement |
|---|---|---|---|---|
| 2025 | $2,143 | $93,000 | $24,200 | $68,800 |
| 2024 | $2,143 | $93,000 | $24,200 | $68,800 |
| 2023 | $2,143 | $93,000 | $24,200 | $68,800 |
| 2022 | $2,115 | $93,000 | $24,200 | $68,800 |
| 2021 | $2,115 | $93,000 | $24,200 | $68,800 |
| 2020 | $2,105 | $93,000 | $24,200 | $68,800 |
| 2019 | $2,105 | $93,000 | $24,200 | $68,800 |
| 2018 | $1,595 | $93,000 | $24,200 | $68,800 |
| 2017 | $2,105 | $93,000 | $24,200 | $68,800 |
| 2016 | $440 | $93,000 | $24,200 | $68,800 |
| 2015 | $440 | $93,000 | $24,200 | $68,800 |
| 2014 | $2,058 | $93,000 | $24,200 | $68,800 |
Source: Public Records
Map
Nearby Homes
- 155 Labelle St
- 600 Grandview Ave
- 0 Amabell St
- 201 Amabell St
- 212 Amabell St
- 324 Labelle St
- 1105 Grandview Ave Unit 1A
- 1102 Grandview Ave Unit 9
- 1000 Grandview Ave Unit 1207
- 1000 Grandview Ave Unit 1103
- 1000 Grandview Ave
- 1000 Grandview Ave Unit 401
- 323 Hallock St
- 224 Meridan St
- 410 Sulgrave Rd
- 226 Merrimac St
- 415 Bigham St Unit 23
- 147 Meridan St
- 237 Oneida St
- 426 Sulgrave Rd
- 127 Labelle St
- 135 Labelle St
- 125 Labelle St
- 137 Labelle St
- 121 Labelle St
- 141 Labelle St
- 128 Labelle St
- 132 Labelle St
- 143 Labelle St
- 810 Vaux Way
- 146 Labelle St
- 140 Labelle St
- 118 Bigham St
- 120 Bigham St
- 116 Bigham St
- 116 Bigham St Unit 2
- 116 Bigham St Unit 3
- 136 Labelle St
- 126 Labelle St
- 145 Labelle St