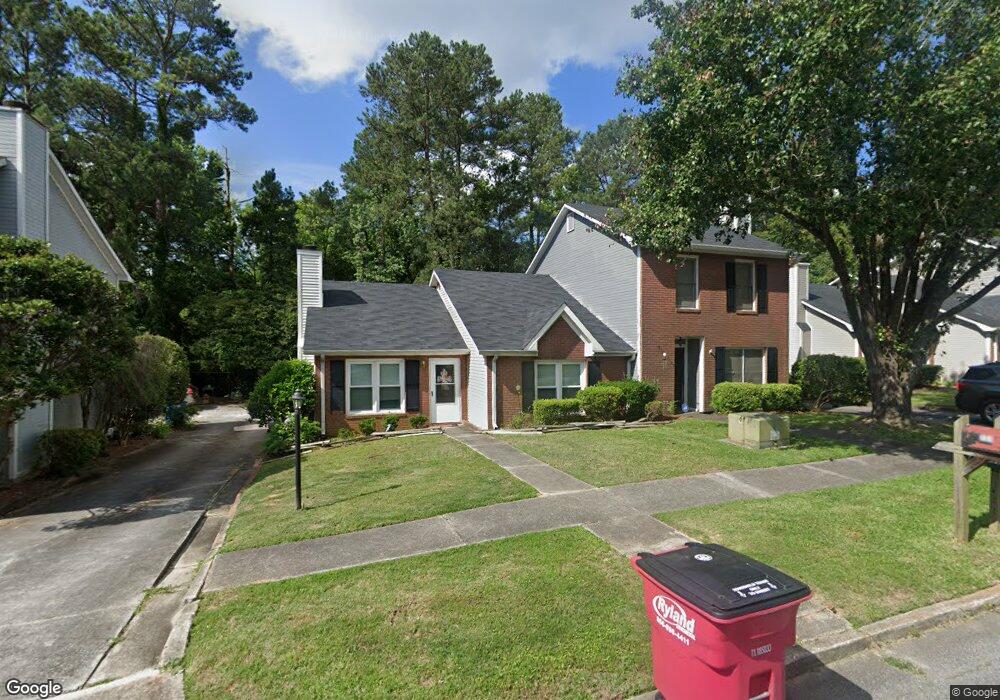
131 Manor Row Macon, GA 31210
Estimated Value: $163,000 - $168,000
2
Beds
2
Baths
1,235
Sq Ft
$134/Sq Ft
Est. Value
About This Home
This home is located at 131 Manor Row, Macon, GA 31210 and is currently estimated at $165,096, approximately $133 per square foot. 131 Manor Row is a home located in Bibb County with nearby schools including Carter Elementary School, Howard Middle School, and Howard High School.
Ownership History
Date
Name
Owned For
Owner Type
Purchase Details
Closed on
Nov 4, 2019
Sold by
Sealy Tucker Lois Key
Bought by
Sealy Tucker Lois Key
Current Estimated Value
Purchase Details
Closed on
Aug 17, 2018
Sold by
Tucker Natalie Sylvia
Bought by
Tucker David Timothy
Purchase Details
Closed on
May 10, 2004
Bought by
Tucker Tucker H and Tucker Gloria O
Purchase Details
Closed on
Aug 7, 2000
Purchase Details
Closed on
Feb 16, 1998
Create a Home Valuation Report for This Property
The Home Valuation Report is an in-depth analysis detailing your home's value as well as a comparison with similar homes in the area
Home Values in the Area
Average Home Value in this Area
Purchase History
| Date | Buyer | Sale Price | Title Company |
|---|---|---|---|
| Sealy Tucker Lois Key | -- | None Available | |
| Tucker David Timothy | $14,350 | None Available | |
| Tucker David Timothy | $14,350 | None Available | |
| Tucker David Timothy | -- | None Available | |
| Tucker Tucker H | $94,000 | -- | |
| -- | $86,000 | -- | |
| -- | $78,900 | -- |
Source: Public Records
Tax History Compared to Growth
Tax History
| Year | Tax Paid | Tax Assessment Tax Assessment Total Assessment is a certain percentage of the fair market value that is determined by local assessors to be the total taxable value of land and additions on the property. | Land | Improvement |
|---|---|---|---|---|
| 2025 | $1,435 | $58,408 | $8,000 | $50,408 |
| 2024 | $1,294 | $50,940 | $8,000 | $42,940 |
| 2023 | $1,151 | $45,339 | $8,000 | $37,339 |
| 2022 | $1,340 | $38,693 | $5,280 | $33,413 |
| 2021 | $1,318 | $34,683 | $5,280 | $29,403 |
| 2020 | $1,295 | $33,347 | $5,280 | $28,067 |
| 2019 | $1,305 | $33,347 | $5,280 | $28,067 |
| 2018 | $2,099 | $32,010 | $5,280 | $26,730 |
| 2017 | $1,081 | $28,857 | $4,800 | $24,057 |
| 2016 | $998 | $28,857 | $4,800 | $24,057 |
| 2015 | $1,748 | $35,703 | $6,300 | $29,403 |
| 2014 | $584 | $35,703 | $6,300 | $29,403 |
Source: Public Records
Map
Nearby Homes
- 311 Castlegate Rd
- 331 Marjane Dr
- 105 N Wellington
- 107 N Wellington
- 5181 Zebulon Rd
- 111 the Vinings
- 757 Silver Springs Dr
- 218 Matlock Ln
- 106 Trillium Terrace
- 200 Stone Edge Rd
- 131 Ashford Park
- 163 Broadleaf Dr
- 137 Senora Place
- 103 Howard Oaks Dr
- 155 Howard Oaks Dr
- 5104 Pine Ridge Dr
- 181 Rivoli Landing
- 118 Ashford Park