131 Maple St Attleboro, MA 02703
Estimated Value: $318,065 - $450,000
1
Bed
1
Bath
630
Sq Ft
$598/Sq Ft
Est. Value
About This Home
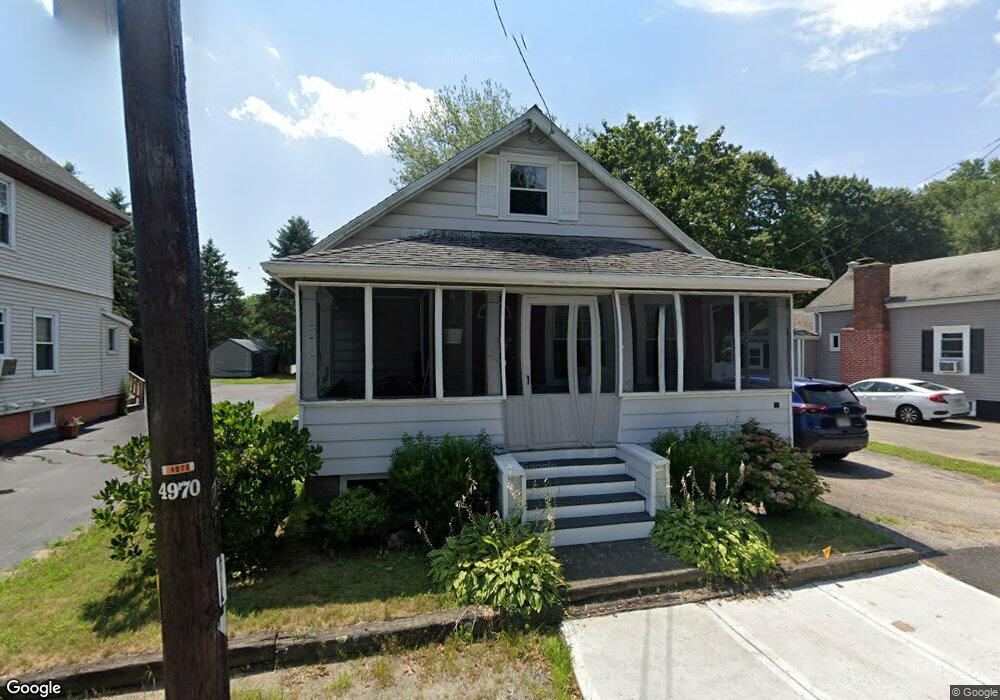
This home is located at 131 Maple St, Attleboro, MA 02703 and is currently estimated at $377,016, approximately $598 per square foot. 131 Maple St is a home located in Bristol County with nearby schools including Peter Thacher Elementary School, Wamsutta Middle School, and Attleboro High School.
Ownership History
Date
Name
Owned For
Owner Type
Purchase Details
Closed on
Jul 12, 2024
Sold by
Brown Deborah
Bought by
131 Maple St Rt and Brown
Current Estimated Value
Purchase Details
Closed on
Sep 27, 1996
Sold by
Dwyer F Gertrude Est
Bought by
Brown Deborah
Home Financials for this Owner
Home Financials are based on the most recent Mortgage that was taken out on this home.
Original Mortgage
$52,000
Interest Rate
7.83%
Mortgage Type
Purchase Money Mortgage
Create a Home Valuation Report for This Property
The Home Valuation Report is an in-depth analysis detailing your home's value as well as a comparison with similar homes in the area
Home Values in the Area
Average Home Value in this Area
Purchase History
| Date | Buyer | Sale Price | Title Company |
|---|---|---|---|
| 131 Maple St Rt | -- | None Available | |
| 131 Maple St Rt | -- | None Available | |
| Brown Deborah | $65,000 | -- | |
| Brown Deborah | $65,000 | -- |
Source: Public Records
Mortgage History
| Date | Status | Borrower | Loan Amount |
|---|---|---|---|
| Previous Owner | Brown Deborah | $18,000 | |
| Previous Owner | Brown Deborah | $50,000 | |
| Previous Owner | Brown Deborah | $52,000 |
Source: Public Records
Tax History
| Year | Tax Paid | Tax Assessment Tax Assessment Total Assessment is a certain percentage of the fair market value that is determined by local assessors to be the total taxable value of land and additions on the property. | Land | Improvement |
|---|---|---|---|---|
| 2025 | $3,342 | $266,300 | $110,600 | $155,700 |
| 2024 | $3,368 | $264,600 | $110,600 | $154,000 |
| 2023 | $3,104 | $226,700 | $100,500 | $126,200 |
| 2022 | $3,193 | $221,000 | $95,700 | $125,300 |
| 2021 | $3,281 | $221,700 | $92,100 | $129,600 |
| 2020 | $3,008 | $206,600 | $89,300 | $117,300 |
| 2019 | $2,757 | $194,700 | $87,600 | $107,100 |
| 2018 | $2,626 | $177,200 | $85,000 | $92,200 |
| 2017 | $2,456 | $168,800 | $85,000 | $83,800 |
| 2016 | $2,272 | $153,300 | $79,500 | $73,800 |
| 2015 | $2,111 | $143,500 | $79,500 | $64,000 |
| 2014 | $1,980 | $133,300 | $75,300 | $58,000 |
Source: Public Records
Map
Nearby Homes
- 95 Mulberry St
- 91 East St
- 17 Davis Ave
- 567 Park St
- 61 Pine St Unit 9
- 45 Holman St
- 28 Pine St Unit C
- 37 Holman St
- 17 Capron St
- 67 Steeple Chase Cir Unit 1
- 32 Park St Unit 4
- 0 Rosedale Ln Unit 73469293
- 35 Christopher Dr
- 0 Cherry Tree Ln
- 147 County St
- 18-20 Jefferson St
- 21 4th St
- 0 Paisley Way Unit 73482376
- 0 Paisley Way Unit 73482325
- 49 Dennis St
Your Personal Tour Guide
Ask me questions while you tour the home.