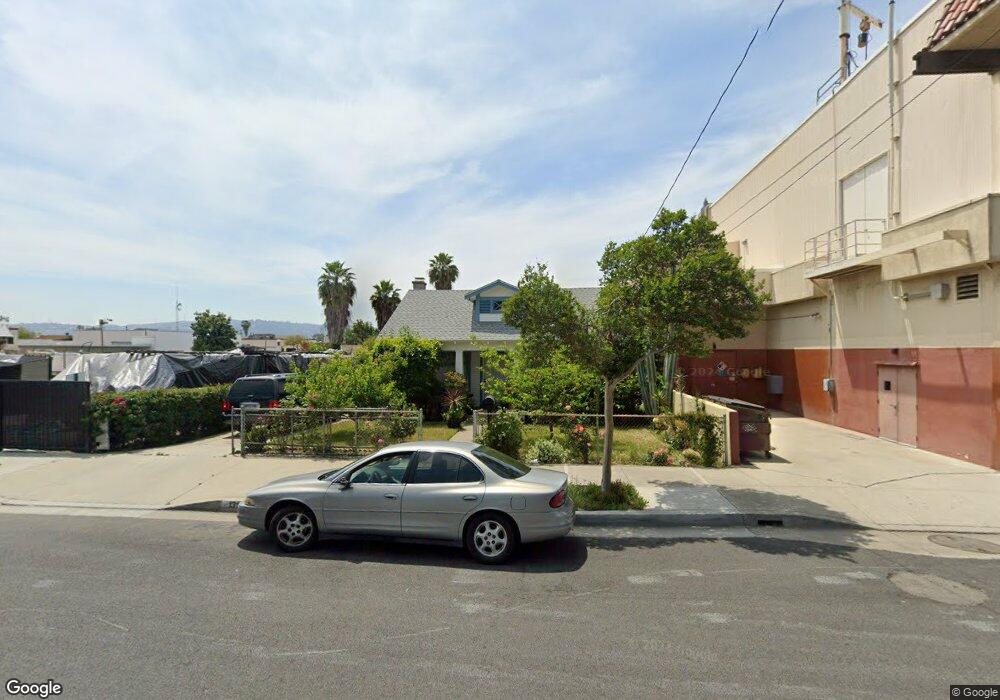
131 N 2nd St La Puente, CA 91744
Estimated Value: $682,000 - $702,000
2
Beds
1
Bath
1,040
Sq Ft
$665/Sq Ft
Est. Value
About This Home
This home is located at 131 N 2nd St, La Puente, CA 91744 and is currently estimated at $691,190, approximately $664 per square foot. 131 N 2nd St is a home located in Los Angeles County with nearby schools including Workman Elementary School, Sierra Vista Middle School, and La Puente High School.
Ownership History
Date
Name
Owned For
Owner Type
Purchase Details
Closed on
Dec 7, 2014
Sold by
The Borunda Living Trust
Bought by
Neag Melissa Ann and Borunda Michael Leo
Current Estimated Value
Purchase Details
Closed on
Aug 17, 2007
Sold by
Dudley Gary Wayne
Bought by
Klinakis Charles
Purchase Details
Closed on
Sep 16, 2003
Sold by
Klinakis Raquel
Bought by
Klinakis Charles
Home Financials for this Owner
Home Financials are based on the most recent Mortgage that was taken out on this home.
Original Mortgage
$180,000
Interest Rate
6.4%
Mortgage Type
Purchase Money Mortgage
Purchase Details
Closed on
Jul 25, 2003
Sold by
Borunda Blanca G
Bought by
Borunda Elihu
Home Financials for this Owner
Home Financials are based on the most recent Mortgage that was taken out on this home.
Original Mortgage
$180,000
Interest Rate
6.4%
Mortgage Type
Purchase Money Mortgage
Purchase Details
Closed on
Dec 1, 1994
Sold by
Elgart Grace F
Bought by
The Grace F Elgart Living Trust
Create a Home Valuation Report for This Property
The Home Valuation Report is an in-depth analysis detailing your home's value as well as a comparison with similar homes in the area
Home Values in the Area
Average Home Value in this Area
Purchase History
| Date | Buyer | Sale Price | Title Company |
|---|---|---|---|
| Neag Melissa Ann | -- | None Available | |
| Klinakis Charles | -- | None Available | |
| Klinakis Charles | -- | First American Title | |
| Borunda Elihu | -- | Fidelity National Title Co | |
| The Grace F Elgart Living Trust | -- | -- |
Source: Public Records
Mortgage History
| Date | Status | Borrower | Loan Amount |
|---|---|---|---|
| Previous Owner | Klinakis Charles | $180,000 |
Source: Public Records
Tax History
| Year | Tax Paid | Tax Assessment Tax Assessment Total Assessment is a certain percentage of the fair market value that is determined by local assessors to be the total taxable value of land and additions on the property. | Land | Improvement |
|---|---|---|---|---|
| 2025 | $4,535 | $347,066 | $228,471 | $118,595 |
| 2024 | $4,535 | $340,262 | $223,992 | $116,270 |
| 2023 | $4,423 | $333,591 | $219,600 | $113,991 |
| 2022 | $4,298 | $327,051 | $215,295 | $111,756 |
| 2021 | $4,224 | $320,639 | $211,074 | $109,565 |
| 2019 | $4,106 | $311,130 | $204,814 | $106,316 |
| 2018 | $3,941 | $305,031 | $200,799 | $104,232 |
| 2016 | $3,660 | $293,188 | $193,002 | $100,186 |
| 2015 | $3,593 | $288,785 | $190,103 | $98,682 |
| 2014 | $3,539 | $283,129 | $186,380 | $96,749 |
Source: Public Records
Map
Nearby Homes
- 209 N Stimson Ave
- 226 Shay Ave
- 16149 Abbey St
- 16142 Abbey St
- 16060 Las Vecinas Dr
- 16203 Bluebonnet St
- 611 Santo Oro Ave
- 16374 Bamboo St
- 16459 Main St
- 421 Dalesford Dr
- 138 Banbridge Ave
- 15865 Sierra Vista Ct
- 1122 Marchmont Ave
- 16244 Folger St
- 16228 Folger St
- 16232 Folger St
- 16240 Folger St
- 826 Del Valle Ave
- 16252 Folger St
- 1104 Silverwood Way
Your Personal Tour Guide
Ask me questions while you tour the home.