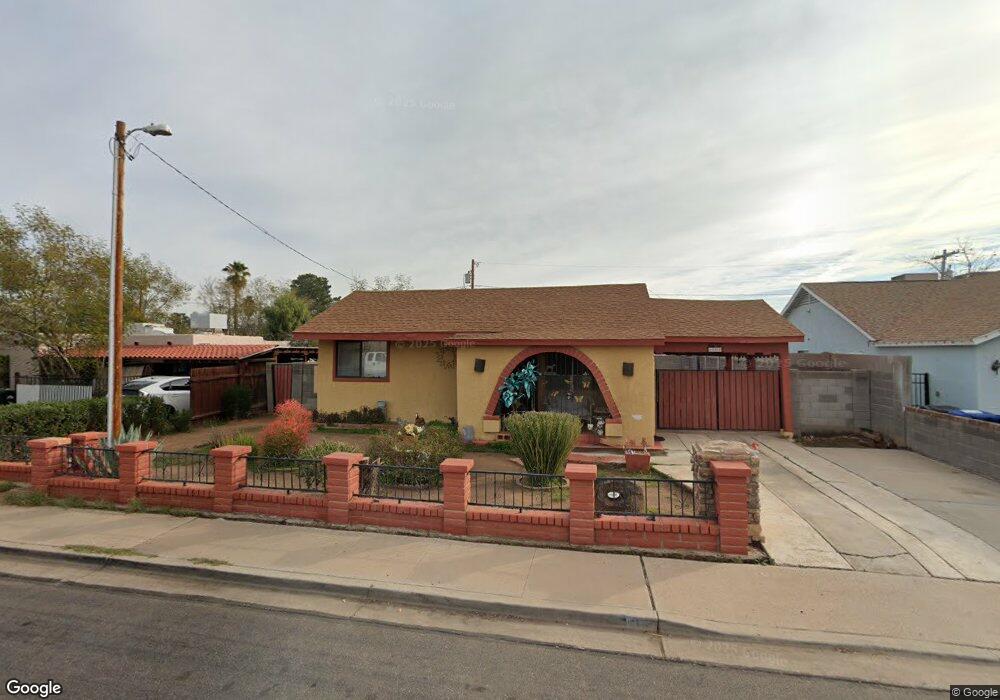
131 N Matlock St Mesa, AZ 85203
Fraser Fields NeighborhoodEstimated Value: $267,480 - $338,000
--
Bed
1
Bath
960
Sq Ft
$307/Sq Ft
Est. Value
About This Home
This home is located at 131 N Matlock St, Mesa, AZ 85203 and is currently estimated at $294,870, approximately $307 per square foot. 131 N Matlock St is a home located in Maricopa County with nearby schools including Edison Elementary School, Franklin at Brimhall Elementary School, and Franklin West Elementary School.
Ownership History
Date
Name
Owned For
Owner Type
Purchase Details
Closed on
Jan 17, 1997
Sold by
Elola Elisa and Gardner Lilly
Bought by
Romero Ernest James
Current Estimated Value
Home Financials for this Owner
Home Financials are based on the most recent Mortgage that was taken out on this home.
Original Mortgage
$45,654
Outstanding Balance
$5,006
Interest Rate
7.86%
Mortgage Type
FHA
Estimated Equity
$289,864
Create a Home Valuation Report for This Property
The Home Valuation Report is an in-depth analysis detailing your home's value as well as a comparison with similar homes in the area
Home Values in the Area
Average Home Value in this Area
Purchase History
| Date | Buyer | Sale Price | Title Company |
|---|---|---|---|
| Romero Ernest James | $45,000 | Fidelity Title |
Source: Public Records
Mortgage History
| Date | Status | Borrower | Loan Amount |
|---|---|---|---|
| Open | Romero Ernest James | $45,654 |
Source: Public Records
Tax History Compared to Growth
Tax History
| Year | Tax Paid | Tax Assessment Tax Assessment Total Assessment is a certain percentage of the fair market value that is determined by local assessors to be the total taxable value of land and additions on the property. | Land | Improvement |
|---|---|---|---|---|
| 2025 | $480 | $5,776 | -- | -- |
| 2024 | $485 | $5,501 | -- | -- |
| 2023 | $485 | $18,960 | $3,790 | $15,170 |
| 2022 | $474 | $14,160 | $2,830 | $11,330 |
| 2021 | $487 | $14,000 | $2,800 | $11,200 |
| 2020 | $481 | $12,780 | $2,550 | $10,230 |
| 2019 | $445 | $9,830 | $1,960 | $7,870 |
| 2018 | $425 | $9,060 | $1,810 | $7,250 |
| 2017 | $412 | $6,930 | $1,380 | $5,550 |
| 2016 | $404 | $4,920 | $980 | $3,940 |
| 2015 | $382 | $4,730 | $940 | $3,790 |
Source: Public Records
Map
Nearby Homes
- 1138 E 2nd St
- 62 N Parsell -- N Unit 22
- 135 N Stapley Dr
- 1040 E Main St
- 955 E Main St
- 1102 E University Dr
- 1311 E 2nd Place
- 38 N Fraser Dr W
- 757 E 2nd St
- 1756 E University Dr
- 520 N Stapley Dr Unit 108
- 520 N Stapley Dr Unit 285
- 520 N Stapley Dr Unit 248
- 1132 E Nielson Ave
- 707 E University Dr
- 1402 E Dana Ave
- 211 S Doran
- 1505 E 3rd Place
- 448 N Ashland
- 601 E University Dr
- 137 N Matlock St
- 125 N Matlock St
- 143 N Matlock St
- 119 N Matlock St
- 132 N Spencer
- 126 N Spencer
- 138 N Spencer
- 122 N Spencer
- 144 N Spencer
- 132 N Matlock St
- 149 N Matlock St
- 113 N Matlock St
- 138 N Matlock St
- 126 N Matlock St
- 144 N Matlock St
- 120 N Matlock St
- 114 N Spencer
- 150 N Spencer
- 155 N Matlock St
- 107 N Matlock St