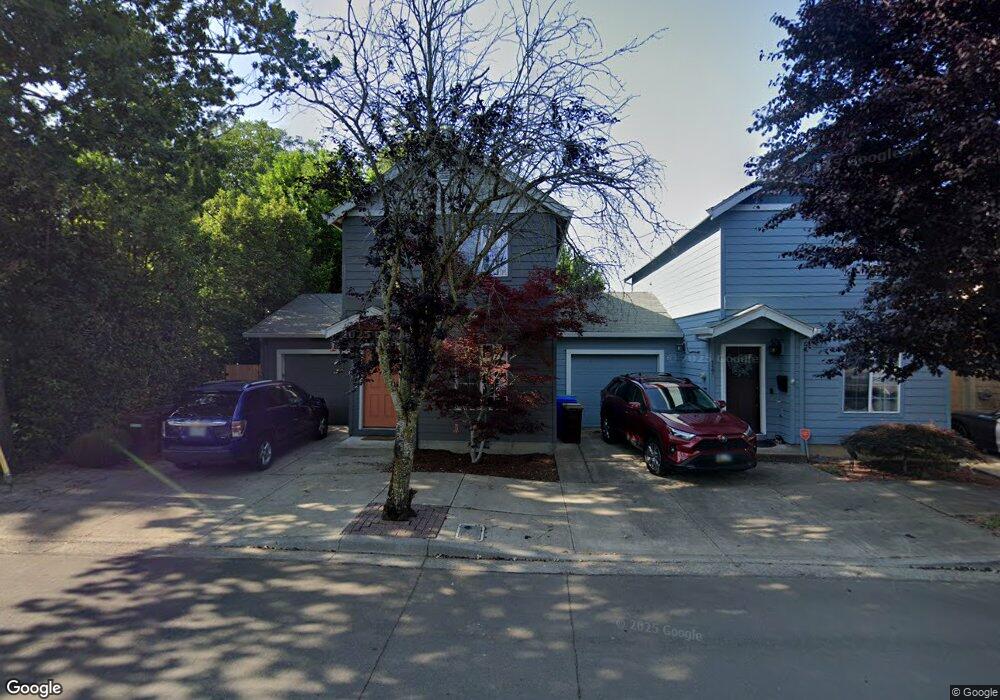
131 NW 8th St Gresham, OR 97030
Downtown Gresham NeighborhoodEstimated Value: $272,059 - $322,000
2
Beds
2
Baths
1,024
Sq Ft
$289/Sq Ft
Est. Value
About This Home
This home is located at 131 NW 8th St, Gresham, OR 97030 and is currently estimated at $295,515, approximately $288 per square foot. 131 NW 8th St is a home located in Multnomah County with nearby schools including Highland Elementary School, Clear Creek Middle School, and Gresham High School.
Ownership History
Date
Name
Owned For
Owner Type
Purchase Details
Closed on
Nov 15, 2019
Sold by
Wiese Cynthia L and Pongracz Cynthia L
Bought by
Weise Cynthia L
Current Estimated Value
Home Financials for this Owner
Home Financials are based on the most recent Mortgage that was taken out on this home.
Original Mortgage
$82,500
Outstanding Balance
$55,140
Interest Rate
3.6%
Mortgage Type
New Conventional
Estimated Equity
$240,375
Purchase Details
Closed on
May 1, 2006
Sold by
Paradis Andrew R
Bought by
Pongracz Cindy L
Home Financials for this Owner
Home Financials are based on the most recent Mortgage that was taken out on this home.
Original Mortgage
$100,050
Interest Rate
6.29%
Mortgage Type
Fannie Mae Freddie Mac
Purchase Details
Closed on
Aug 28, 2002
Sold by
Glc Properties Inc
Bought by
Paradis Andrew R and Paradis Ann P
Home Financials for this Owner
Home Financials are based on the most recent Mortgage that was taken out on this home.
Original Mortgage
$107,960
Interest Rate
5.37%
Mortgage Type
Purchase Money Mortgage
Create a Home Valuation Report for This Property
The Home Valuation Report is an in-depth analysis detailing your home's value as well as a comparison with similar homes in the area
Home Values in the Area
Average Home Value in this Area
Purchase History
| Date | Buyer | Sale Price | Title Company |
|---|---|---|---|
| Weise Cynthia L | -- | Wfg Lender Services | |
| Pongracz Cindy L | $168,000 | Chicago Title Insurance Comp | |
| Paradis Andrew R | $134,950 | Chicago Title |
Source: Public Records
Mortgage History
| Date | Status | Borrower | Loan Amount |
|---|---|---|---|
| Open | Weise Cynthia L | $82,500 | |
| Closed | Pongracz Cindy L | $100,050 | |
| Previous Owner | Paradis Andrew R | $107,960 | |
| Closed | Paradis Andrew R | $20,240 |
Source: Public Records
Tax History
| Year | Tax Paid | Tax Assessment Tax Assessment Total Assessment is a certain percentage of the fair market value that is determined by local assessors to be the total taxable value of land and additions on the property. | Land | Improvement |
|---|---|---|---|---|
| 2025 | $3,068 | $150,750 | -- | -- |
| 2024 | $2,937 | $146,360 | -- | -- |
| 2023 | $2,675 | $142,100 | $0 | $0 |
| 2022 | $2,601 | $137,970 | $0 | $0 |
| 2021 | $2,535 | $133,960 | $0 | $0 |
| 2020 | $2,386 | $130,060 | $0 | $0 |
| 2019 | $2,323 | $126,280 | $0 | $0 |
| 2018 | $2,215 | $122,610 | $0 | $0 |
| 2017 | $2,125 | $119,040 | $0 | $0 |
| 2016 | $1,874 | $115,580 | $0 | $0 |
Source: Public Records
Map
Nearby Homes
- 0 NE 5th St
- 54 NW 13th St
- 210 NE 5th St
- 318 NE Roberts Ave Unit 308
- 318 NE Roberts Ave Unit 203
- 660 NE 9th St
- 491 NE Elliott Ave
- 894 NE Linden Ave
- 1783 1791 NE Beech Place
- 349 NE 18th St
- 234 NE Cleveland Ave
- 994 NW Wallula Ave
- 415 SE Roberts Ave
- 450 NE 22nd St
- 417 SE Roberts Ave
- 1325 NW 9th St
- 0 NE 6th St
- 1113 W Powell Blvd
- 159 SW Florence Ave Unit 64
- 159 SW Florence Ave
- 117 NW 8th St
- 109 NW 8th St
- 817 NW Earl Ave
- 812 NW Mignonette Ave
- 824 NW Mignonette Ave
- 833 NW Earl Ave
- 835 NW Earl Ave
- 840 NW Mignonette Ave
- 25 NW 8th St
- 820 NW Earl Ave
- 843 NW Earl Ave
- 23 NW 8th St
- 803 NW Mignonette Ave
- 807 NW Mignonette Ave
- 809 NW Mignonette Ave
- 811 NW Mignonette Ave
- 890 NW Mignonette Ave Unit 892
- 823 NW Mignonette Ave
- 840 NW Earl Ave Unit 940
- 831 NW Mignonette Ave
Your Personal Tour Guide
Ask me questions while you tour the home.