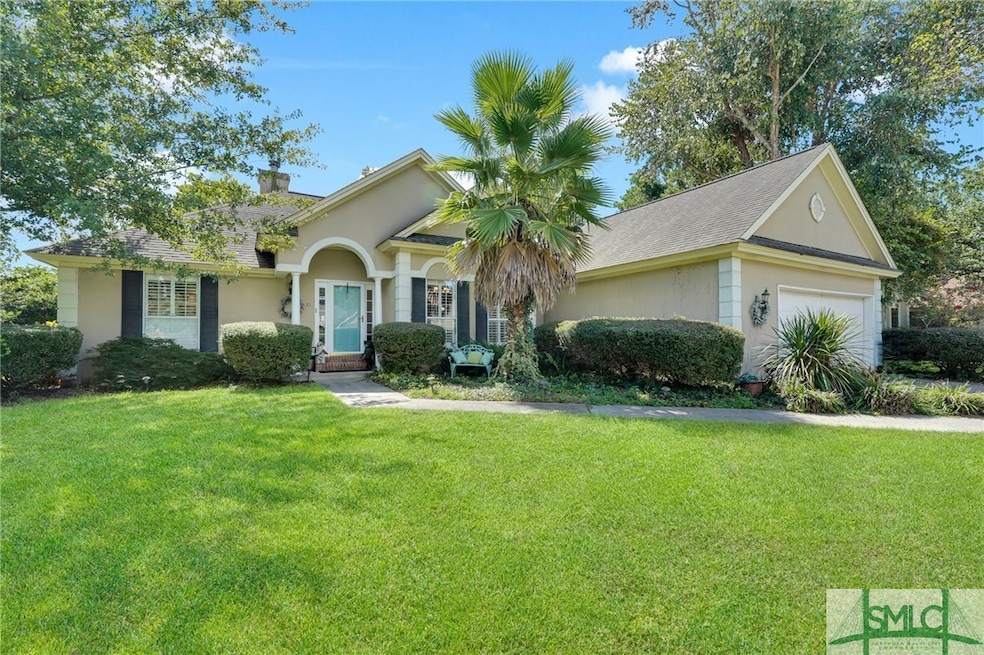
131 Summer Winds Dr Savannah, GA 31410
Whitemarsh Island NeighborhoodEstimated payment $3,330/month
About This Home
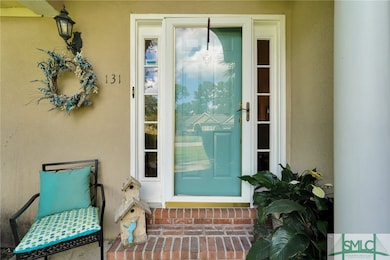
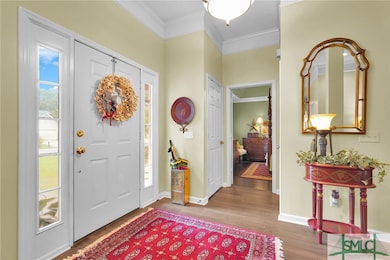
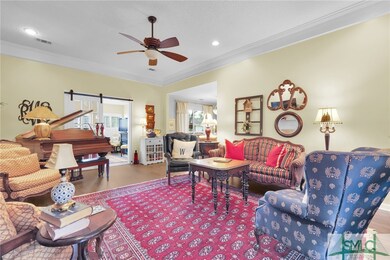
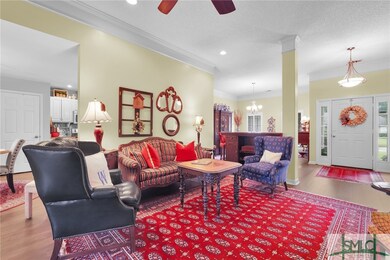
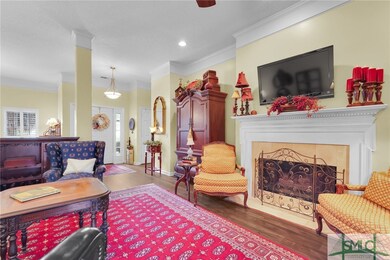
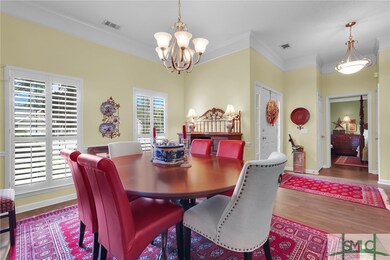
131 Summer Winds welcomes you with its high ceilings, built-in cabinets, and a gas fireplace in the spacious great room. The home features an open floor plan with formal dining room plus a breakfast nook in the kitchen, which boasts granite countertops and stainless steel appliances. It offers a split bedroom layout with three bedrooms and two bathrooms on the main level, plus a fourth bedroom or bonus room above the two-car garage. A barn-style French door leads to a sunroom, which opens onto a large deck. The deck's covered area is ideal for grilling, watching college football in the fall on the outdoor TV, or sipping your morning coffee, while the uncovered section is great for basking in the sun once the warmth of Savannah fades. Situated ideally between Savannah's historic district, Tybee Island, and the Victory Drive corridor, this is a perfect place to call home! Listing broker is a family member of the seller.
Listing Agent
Jeff Welch
Benchmark Properties of Sav License #343404 Listed on: 09/05/2024
Map
Home Details
Home Type
Single Family
Year Built
1994
Lot Details
0
HOA Fees
$18 per month
Parking
2
Listing Details
- Property Type: Residential
- Year Built: 1994
- Special Features: VirtualTour
- Property Sub Type: Detached
- Stories: 1
Interior Features
- Interior Amenities: Breakfast Area, Double Vanity, Entrance Foyer, Garden Tub/Roman Tub, High Ceilings, Main Level Primary, Primary Suite, Pull Down Attic Stairs, Recessed Lighting, Split Bedrooms, Separate Shower
Utilities
- Utilities: Cable Available, Underground Utilities
- Water Source: Public
Lot Info
- Zoning: R1
Tax Info
- Tax Year: 2023
MLS Schools
- Elementary School: Marshpoint
- High School: Islands
Home Values in the Area
Average Home Value in this Area
Tax History
| Year | Tax Paid | Tax Assessment Tax Assessment Total Assessment is a certain percentage of the fair market value that is determined by local assessors to be the total taxable value of land and additions on the property. | Land | Improvement |
|---|---|---|---|---|
| 2025 | $4,092 | $203,000 | $50,400 | $152,600 |
| 2024 | $4,092 | $169,280 | $50,400 | $118,880 |
| 2023 | $3,259 | $140,360 | $25,200 | $115,160 |
| 2022 | $3,664 | $129,200 | $25,200 | $104,000 |
| 2021 | $3,747 | $123,280 | $25,200 | $98,080 |
| 2020 | $3,682 | $123,280 | $25,200 | $98,080 |
| 2019 | $3,793 | $123,280 | $25,200 | $98,080 |
| 2018 | $3,761 | $119,680 | $25,200 | $94,480 |
| 2017 | $3,575 | $105,520 | $25,200 | $80,320 |
| 2016 | $3,319 | $104,600 | $25,200 | $79,400 |
| 2015 | $3,595 | $105,720 | $25,200 | $80,520 |
Property History
| Date | Event | Price | List to Sale | Price per Sq Ft | Prior Sale |
|---|---|---|---|---|---|
| 09/05/2024 09/05/24 | For Sale | $585,000 | +76.7% | $254 / Sq Ft | |
| 10/02/2017 10/02/17 | Sold | $331,000 | -2.4% | $124 / Sq Ft | View Prior Sale |
| 08/23/2017 08/23/17 | Pending | -- | -- | -- | |
| 04/27/2017 04/27/17 | For Sale | $339,000 | +18.9% | $127 / Sq Ft | |
| 04/23/2014 04/23/14 | Sold | $285,000 | -4.8% | $107 / Sq Ft | View Prior Sale |
| 04/23/2014 04/23/14 | Pending | -- | -- | -- | |
| 08/27/2013 08/27/13 | For Sale | $299,500 | -- | $112 / Sq Ft |
Purchase History
| Date | Type | Sale Price | Title Company |
|---|---|---|---|
| Warranty Deed | $331,000 | -- | |
| Deed | $290,000 | -- |
Mortgage History
| Date | Status | Loan Amount | Loan Type |
|---|---|---|---|
| Open | $264,800 | New Conventional | |
| Previous Owner | $150,000 | New Conventional |
Source: Hive MLS
MLS Number: SA319350
APN: 1014002063
Disclaimer: Certain information contained herein is derived from information provided by parties other than Homes.com. All information provided is deemed reliable, but is not guaranteed to be accurate and should be independently verified.
![]() IDX information is provided exclusively for personal, non-commercial use, and may not be used for any purpose other than to identify prospective properties consumers may be interested in purchasing.
IDX information is provided exclusively for personal, non-commercial use, and may not be used for any purpose other than to identify prospective properties consumers may be interested in purchasing.
Information is deemed reliable but not guaranteed.
- 121 Summer Winds Dr
- 1733 Whitemarsh Way
- 1735 Whitemarsh Way
- 1737 Whitemarsh Way Unit 1737
- 1612 Whitemarsh Way
- 1924 Whitemarsh Way
- 2017 Whitemarsh Way
- 2112 Whitemarsh Way
- 2612 Whitemarsh Way
- 3331 Whitemarsh Way
- 1110 Juanita St
- 2202 Walden Park Dr
- 2305 Walden Park Dr
- 115 Turnbuckle Ct
- 1203 Walden Park Dr
- 303 Mapmaker Ln
- 000 Perry Cove
- 000000 Perry Cove
- 310 Mapmaker Ln
- 1024 Cheryl St
- 1313 Whitemarsh Way
- 509 Hammocks View
- 3325 Whitemarsh Way
- 1110 Wilma St
- 411 Mapmaker Ln
- 25 Johnny Mercer Blvd
- 3204 Walden Park Dr
- 2104 Mercer Point Unit 2104
- 2 Johnny Mercer Blvd
- 4203 Walden Park Dr
- 5305 Walden Park Dr
- 4301 Walden Park Dr
- 225 Redan Dr
- 130 Ropemaker Ln
- 133 Runaway Point Rd
- 2902 River Dr Unit D301
- 450 Johnny Mercer Blvd
- 2612 Whatley Ave Unit 13
- 533 Quarterman Dr Unit ID1244824P
- 58 Chaucer St