Estimated Value: $200,000 - $281,000
Studio
--
Bath
--
Sq Ft
8,843
Sq Ft Lot
About This Home
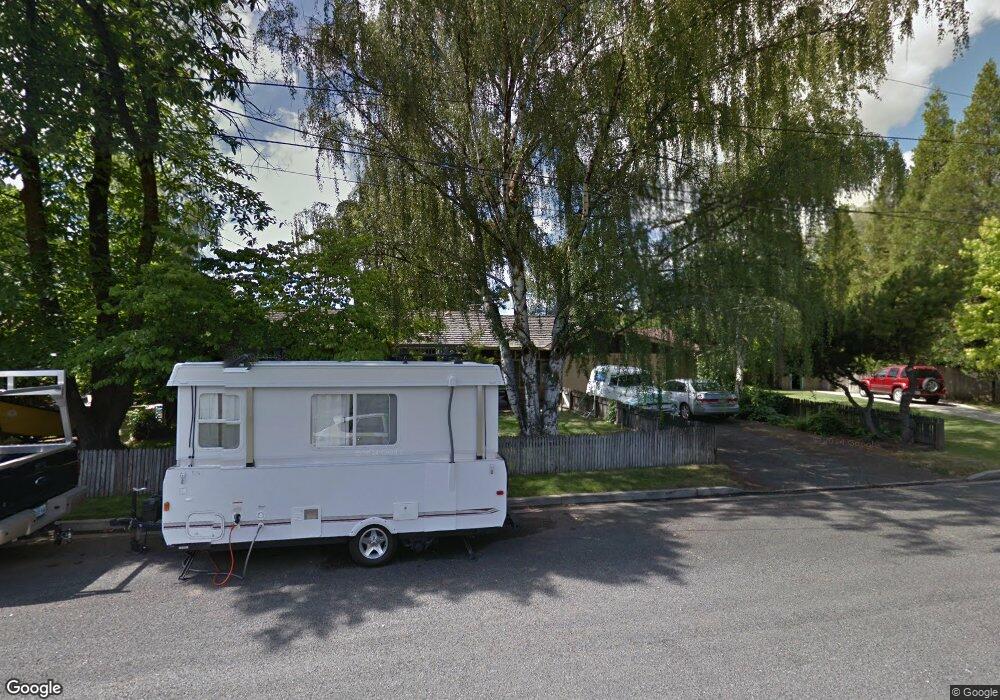
This home is located at 131 Sunset St, Yreka, CA 96097 and is currently estimated at $240,434. 131 Sunset St is a home located in Siskiyou County with nearby schools including Evergreen Elementary School, Jackson Street Elementary School, and Yreka High School.
Ownership History
Date
Name
Owned For
Owner Type
Purchase Details
Closed on
Nov 16, 2009
Sold by
Ross Nicholas W and Palmer Nicolle L
Bought by
Strutz Jeffrey A
Current Estimated Value
Home Financials for this Owner
Home Financials are based on the most recent Mortgage that was taken out on this home.
Original Mortgage
$123,717
Outstanding Balance
$80,741
Interest Rate
4.99%
Mortgage Type
FHA
Estimated Equity
$159,693
Purchase Details
Closed on
Aug 10, 2004
Sold by
Ross Nicholas W
Bought by
Ross Nicholas W and 2004 Nicholas W Ross Revocable
Create a Home Valuation Report for This Property
The Home Valuation Report is an in-depth analysis detailing your home's value as well as a comparison with similar homes in the area
Home Values in the Area
Average Home Value in this Area
Purchase History
| Date | Buyer | Sale Price | Title Company |
|---|---|---|---|
| Strutz Jeffrey A | $126,000 | Siskiyou County Title Co | |
| Ross Nicholas W | -- | -- |
Source: Public Records
Mortgage History
| Date | Status | Borrower | Loan Amount |
|---|---|---|---|
| Open | Strutz Jeffrey A | $123,717 |
Source: Public Records
Tax History
| Year | Tax Paid | Tax Assessment Tax Assessment Total Assessment is a certain percentage of the fair market value that is determined by local assessors to be the total taxable value of land and additions on the property. | Land | Improvement |
|---|---|---|---|---|
| 2025 | $1,593 | $162,630 | $51,627 | $111,003 |
| 2023 | $1,593 | $156,317 | $49,623 | $106,694 |
| 2022 | $1,531 | $153,252 | $48,650 | $104,602 |
| 2021 | $1,503 | $150,248 | $47,697 | $102,551 |
| 2020 | $1,507 | $148,708 | $47,208 | $101,500 |
| 2019 | $1,539 | $145,793 | $46,283 | $99,510 |
| 2018 | $1,509 | $142,935 | $45,376 | $97,559 |
| 2017 | $1,481 | $140,134 | $44,487 | $95,647 |
| 2016 | $1,447 | $137,387 | $43,615 | $93,772 |
| 2015 | $1,425 | $135,324 | $42,960 | $92,364 |
| 2014 | $1,373 | $132,674 | $42,119 | $90,555 |
Source: Public Records
Map
Nearby Homes
Your Personal Tour Guide
Ask me questions while you tour the home.