Estimated Value: $99,000 - $113,873
1
Bed
1
Bath
942
Sq Ft
$116/Sq Ft
Est. Value
About This Home
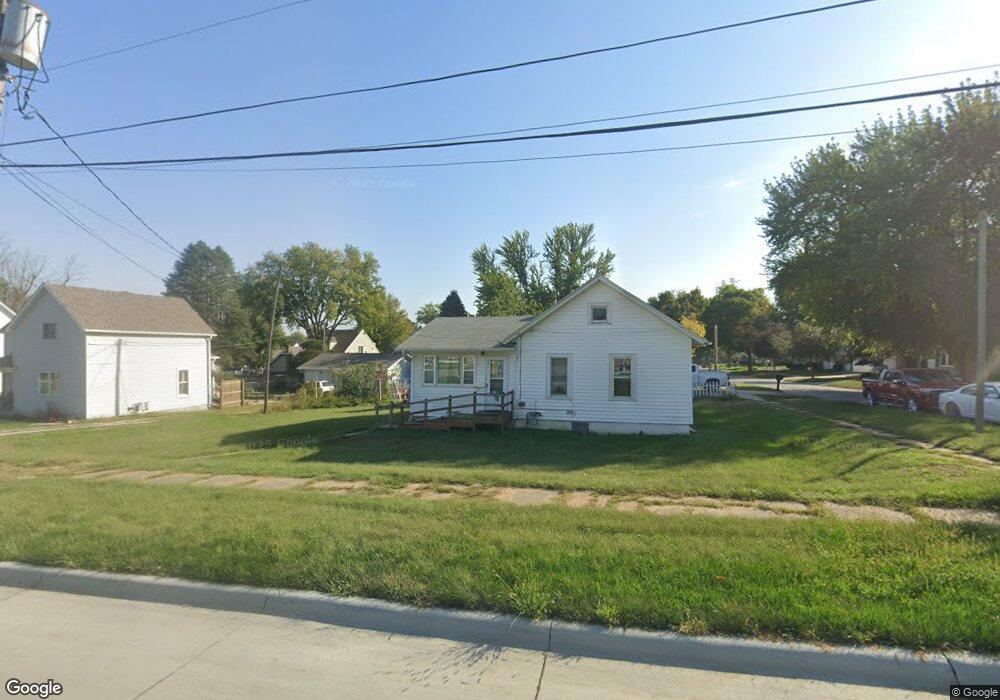
This home is located at 131 W 4th St, Logan, IA 51546 and is currently estimated at $108,968, approximately $115 per square foot. 131 W 4th St is a home located in Harrison County with nearby schools including Logan-Magnolia Elementary School and Logan-Magnolia Junior/Senior High School.
Ownership History
Date
Name
Owned For
Owner Type
Purchase Details
Closed on
Nov 26, 2019
Sold by
Charbonneau Andy
Bought by
Charbonneau Brady T
Current Estimated Value
Home Financials for this Owner
Home Financials are based on the most recent Mortgage that was taken out on this home.
Original Mortgage
$53,350
Outstanding Balance
$44,900
Interest Rate
3.7%
Mortgage Type
New Conventional
Estimated Equity
$64,068
Purchase Details
Closed on
Jun 14, 2011
Sold by
Royer Jay A and Royer Sandy
Bought by
Charbonneau Andrew Louis
Home Financials for this Owner
Home Financials are based on the most recent Mortgage that was taken out on this home.
Original Mortgage
$38,986
Interest Rate
4.87%
Mortgage Type
FHA
Purchase Details
Closed on
Feb 25, 2011
Sold by
Estate Of Joyce A Royer
Bought by
Royer Jay A
Purchase Details
Closed on
Jun 1, 2007
Sold by
Mcadams Betty D
Bought by
Royer Joyce A
Create a Home Valuation Report for This Property
The Home Valuation Report is an in-depth analysis detailing your home's value as well as a comparison with similar homes in the area
Purchase History
| Date | Buyer | Sale Price | Title Company |
|---|---|---|---|
| Charbonneau Brady T | $55,000 | -- | |
| Charbonneau Andrew Louis | $40,000 | Washington County Abstrac | |
| Royer Jay A | -- | None Available | |
| Royer Joyce A | -- | None Available |
Source: Public Records
Mortgage History
| Date | Status | Borrower | Loan Amount |
|---|---|---|---|
| Open | Charbonneau Brady T | $53,350 | |
| Previous Owner | Charbonneau Andrew Louis | $38,986 |
Source: Public Records
Tax History
| Year | Tax Paid | Tax Assessment Tax Assessment Total Assessment is a certain percentage of the fair market value that is determined by local assessors to be the total taxable value of land and additions on the property. | Land | Improvement |
|---|---|---|---|---|
| 2025 | $1,378 | $86,340 | $14,650 | $71,690 |
| 2024 | $1,378 | $78,380 | $14,650 | $63,730 |
| 2023 | $1,330 | $78,380 | $14,650 | $63,730 |
| 2022 | $1,162 | $59,636 | $14,652 | $44,984 |
| 2021 | $1,162 | $59,636 | $14,652 | $44,984 |
| 2020 | $896 | $56,085 | $14,652 | $41,433 |
| 2019 | $678 | $56,085 | $14,652 | $41,433 |
| 2018 | $660 | $42,382 | $0 | $0 |
| 2017 | $660 | $42,382 | $0 | $0 |
| 2016 | $692 | $42,382 | $0 | $0 |
| 2015 | $692 | $38,182 | $0 | $0 |
| 2014 | $586 | $38,182 | $0 | $0 |
Source: Public Records
Map
Nearby Homes
- 217 N 2nd Ave
- 120 W 6th St
- 114 E 10th St
- 1010 Skyline Dr
- 2613 Niagara Trail
- Lot 18 Mulligan Trail
- 2144 Norton Ave
- LOT 27 Mulligan Trail
- LOT 26 Lmvcc Estates
- 2464 Mulligan Trail
- LOT 20 Lmvcc Estates
- LOT 17 Lmvcc Estates
- LOT 15 Mulligan Trail
- TBD Preston Place 3 Parcels
- TBD Preston Place 2 Parcels
- LOT D Fieldcrest Dr
- LOT 9 & 10 Fieldcrest Dr
- LOT E & K Fieldcrest Dr
- LOT C Fieldcrest Dr
- LOTS 3 & 4 Fieldcrest Dr
Your Personal Tour Guide
Ask me questions while you tour the home.