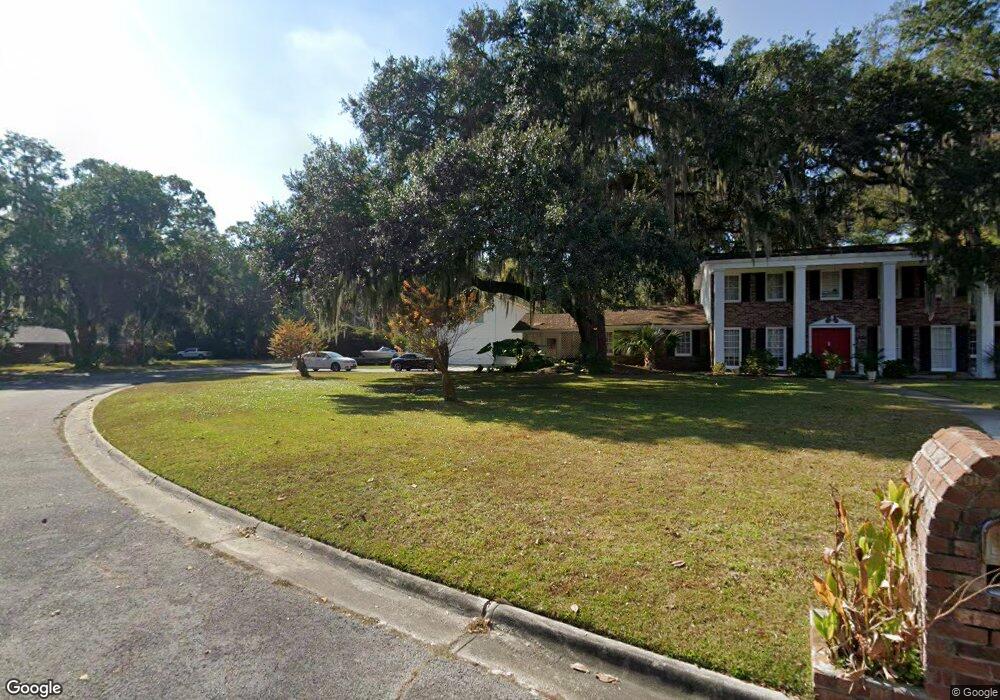
131 Winchester Dr Savannah, GA 31410
Estimated Value: $615,000 - $740,000
3
Beds
3
Baths
2,897
Sq Ft
$231/Sq Ft
Est. Value
About This Home
This home is located at 131 Winchester Dr, Savannah, GA 31410 and is currently estimated at $669,877, approximately $231 per square foot. 131 Winchester Dr is a home located in Chatham County with nearby schools including Howard Elementary School, Coastal Middle School, and Islands High School.
Ownership History
Date
Name
Owned For
Owner Type
Purchase Details
Closed on
Dec 13, 2023
Sold by
Simons Jonathan R
Bought by
Simons Jonathan Robert and Simons Linda
Current Estimated Value
Home Financials for this Owner
Home Financials are based on the most recent Mortgage that was taken out on this home.
Original Mortgage
$540,000
Outstanding Balance
$530,007
Interest Rate
7.44%
Mortgage Type
New Conventional
Estimated Equity
$139,870
Purchase Details
Closed on
Jun 27, 2017
Sold by
Simons Jonathan R
Bought by
Simons Jonathan R and Simons Linda
Home Financials for this Owner
Home Financials are based on the most recent Mortgage that was taken out on this home.
Original Mortgage
$365,000
Interest Rate
3.94%
Mortgage Type
New Conventional
Purchase Details
Closed on
Jul 13, 2007
Sold by
Not Provided
Bought by
Simons Jonathan R
Home Financials for this Owner
Home Financials are based on the most recent Mortgage that was taken out on this home.
Original Mortgage
$329,600
Interest Rate
6.71%
Mortgage Type
New Conventional
Create a Home Valuation Report for This Property
The Home Valuation Report is an in-depth analysis detailing your home's value as well as a comparison with similar homes in the area
Home Values in the Area
Average Home Value in this Area
Purchase History
| Date | Buyer | Sale Price | Title Company |
|---|---|---|---|
| Simons Jonathan Robert | -- | -- | |
| Simons Jonathan R | -- | -- | |
| Simons Jonathan R | $412,000 | -- | |
| Simons Jonathan R | $412,000 | -- |
Source: Public Records
Mortgage History
| Date | Status | Borrower | Loan Amount |
|---|---|---|---|
| Open | Simons Jonathan Robert | $540,000 | |
| Previous Owner | Simons Jonathan R | $365,000 | |
| Previous Owner | Simons Jonathan R | $329,600 | |
| Previous Owner | Simons Jonathan R | $82,400 |
Source: Public Records
Tax History Compared to Growth
Tax History
| Year | Tax Paid | Tax Assessment Tax Assessment Total Assessment is a certain percentage of the fair market value that is determined by local assessors to be the total taxable value of land and additions on the property. | Land | Improvement |
|---|---|---|---|---|
| 2025 | $7,275 | $189,920 | $36,040 | $153,880 |
| 2024 | $7,275 | $193,440 | $36,040 | $157,400 |
| 2023 | $6,071 | $176,520 | $36,040 | $140,480 |
| 2022 | $4,723 | $163,080 | $36,040 | $127,040 |
| 2021 | $4,739 | $132,560 | $36,040 | $96,520 |
| 2020 | $4,946 | $135,560 | $36,040 | $99,520 |
| 2019 | $5,067 | $135,560 | $36,040 | $99,520 |
| 2018 | $5,018 | $133,920 | $36,040 | $97,880 |
| 2017 | $4,469 | $124,120 | $35,640 | $88,480 |
| 2016 | $4,213 | $124,120 | $35,640 | $88,480 |
| 2015 | $4,219 | $124,120 | $35,640 | $88,480 |
| 2014 | $6,320 | $126,600 | $0 | $0 |
Source: Public Records
Map
Nearby Homes
- 35 Clarendon Rd
- 17 N Cromwell Rd
- 111 Carlton Rd
- 229 Island Creek Ln
- 235 Island Creek Ln
- 11 Mary Musgrove Dr
- 12 Cromwell Place
- 127 Druid Cir
- 412 Olde Towne Rd
- 128 Mary Musgrove Dr
- 209 Deerwood Rd
- 401 N Cromwell Rd Unit 2Q
- 401 N Cromwell Rd Unit F6
- 401 N Cromwell Rd Unit T-5
- 401 N Cromwell Rd Unit Q2
- 401 N Cromwell Rd Unit F-5
- 401 N Cromwell Rd Unit Q7
- 1912 Stone St
- 700 Wilmington Island Rd Unit 200
- 700 Wilmington Island Rd Unit 201
- 1 S Millward Rd
- 129 Winchester Dr
- 134 Winchester Dr
- 136 Winchester Dr
- 212 Devonshire Rd
- 203 Winchester Dr
- 301 Wellington Rd
- 132 Winchester Dr
- 210 Devonshire Rd
- 127 Winchester Dr
- 202 Winchester Dr
- 4 S Millward Rd
- 122 S Millward Rd
- 122 Millward Ct
- 303 Wellington Rd
- 201 Wellington Ct
- 211 Devonshire Rd
- 130 Winchester Dr
- 208 Devonshire Rd
- 120 Wynngate Rd