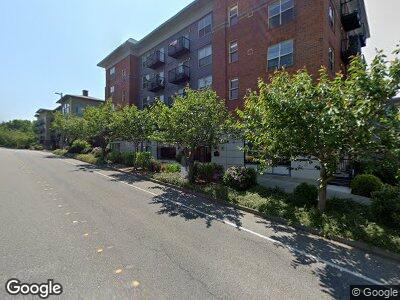
1310 10th St Unit 104 Bellingham, WA 98225
Fairhaven NeighborhoodEstimated Value: $921,711
--
Bed
2
Baths
2,357
Sq Ft
$391/Sq Ft
Est. Value
About This Home
This home is located at 1310 10th St Unit 104, Bellingham, WA 98225 and is currently priced at $921,711, approximately $391 per square foot. 1310 10th St Unit 104 is a home located in Whatcom County with nearby schools including Lowell Elementary School, Fairhaven Middle School, and Sehome High School.
Ownership History
Date
Name
Owned For
Owner Type
Purchase Details
Closed on
Apr 22, 2021
Sold by
Mary C Brett Gst Trust
Bought by
Harris Square Llc
Current Estimated Value
Home Financials for this Owner
Home Financials are based on the most recent Mortgage that was taken out on this home.
Original Mortgage
$760,700
Outstanding Balance
$695,683
Interest Rate
3%
Mortgage Type
New Conventional
Purchase Details
Closed on
Sep 17, 2015
Sold by
Coats Real Estate Llc
Bought by
Brett Mary C
Purchase Details
Closed on
Oct 24, 2007
Sold by
Hansra Family Lp
Bought by
Brett Dean and Brett Mary
Home Financials for this Owner
Home Financials are based on the most recent Mortgage that was taken out on this home.
Original Mortgage
$437,500
Interest Rate
6.29%
Mortgage Type
Commercial
Purchase Details
Closed on
Sep 20, 2005
Sold by
10Th & Harris Block Lp
Bought by
Hansra Family Lp
Create a Home Valuation Report for This Property
The Home Valuation Report is an in-depth analysis detailing your home's value as well as a comparison with similar homes in the area
Home Values in the Area
Average Home Value in this Area
Purchase History
| Date | Buyer | Sale Price | Title Company |
|---|---|---|---|
| Harris Square Llc | $895,000 | Whatcom Land Title | |
| Brett Mary C | $406,411 | Whatcom Land Title | |
| Brett Dean | $725,280 | Whatcom Land Title | |
| Hansra Family Lp | $385,280 | Chicago Title Insurance |
Source: Public Records
Mortgage History
| Date | Status | Borrower | Loan Amount |
|---|---|---|---|
| Open | Harris Square Llc | $760,700 | |
| Previous Owner | Brett Dean | $437,500 |
Source: Public Records
Tax History Compared to Growth
Tax History
| Year | Tax Paid | Tax Assessment Tax Assessment Total Assessment is a certain percentage of the fair market value that is determined by local assessors to be the total taxable value of land and additions on the property. | Land | Improvement |
|---|---|---|---|---|
| 2024 | $3,405 | $481,069 | $79,860 | $401,209 |
| 2023 | $3,405 | $437,335 | $72,600 | $364,735 |
| 2022 | $3,374 | $437,335 | $72,600 | $364,735 |
| 2021 | $3,654 | $361,434 | $60,000 | $301,434 |
| 2020 | $3,783 | $361,434 | $60,000 | $301,434 |
| 2019 | $4,961 | $361,434 | $60,000 | $301,434 |
| 2018 | $5,411 | $475,352 | $41,829 | $433,523 |
| 2017 | $4,767 | $445,082 | $39,165 | $405,917 |
| 2016 | $4,576 | $409,285 | $36,015 | $373,270 |
| 2015 | $4,596 | $409,285 | $36,015 | $373,270 |
| 2014 | -- | $397,750 | $35,000 | $362,750 |
| 2013 | -- | $397,750 | $35,000 | $362,750 |
Source: Public Records
Map
Nearby Homes
- 910 Harris Ave Unit 304
- 910 Harris Ave Unit 407
- 1301 8th St
- 1101 Mckenzie Ave Unit 203
- 1101 Mckenzie Ave Unit 206
- 707 Donovan Ave
- 1315 Mill Ave
- 1014 11th St Unit 302
- 1212 Old Fairhaven Pkwy Unit D202
- 1310 Old Fairhaven Pkwy Unit A-102
- 1216 Old Fairhaven Pkwy Unit C203
- 500 Wilson Ave
- 912 11th St Unit 101
- 1100 Taylor Ave
- 1605 Donovan Ave
- 1005 15th St
- 805 11th St
- 700 11th St Unit C-1
- 700 11th St Unit C4
- 714 13th St
- 1310 10th St Unit 102
- 1310 10th St Unit 101
- 1310 10th St Unit 503
- 1310 10th St Unit 406
- 1310 10th St Unit 403
- 1310 10th St Unit 302
- 1310 10th St Unit 206
- 1310 10th St Unit 205
- 1310 10th St Unit 204
- 1310 10th St Unit 207
- 1310 10th St Unit 505
- 1310 10th St Unit 504
- 1310 10th St Unit 502
- 1310 10th St Unit 501
- 1310 10th St Unit 408
- 1310 10th St Unit 407
- 1310 10th St Unit 405
- 1310 10th St Unit 404
- 1310 10th St Unit 401