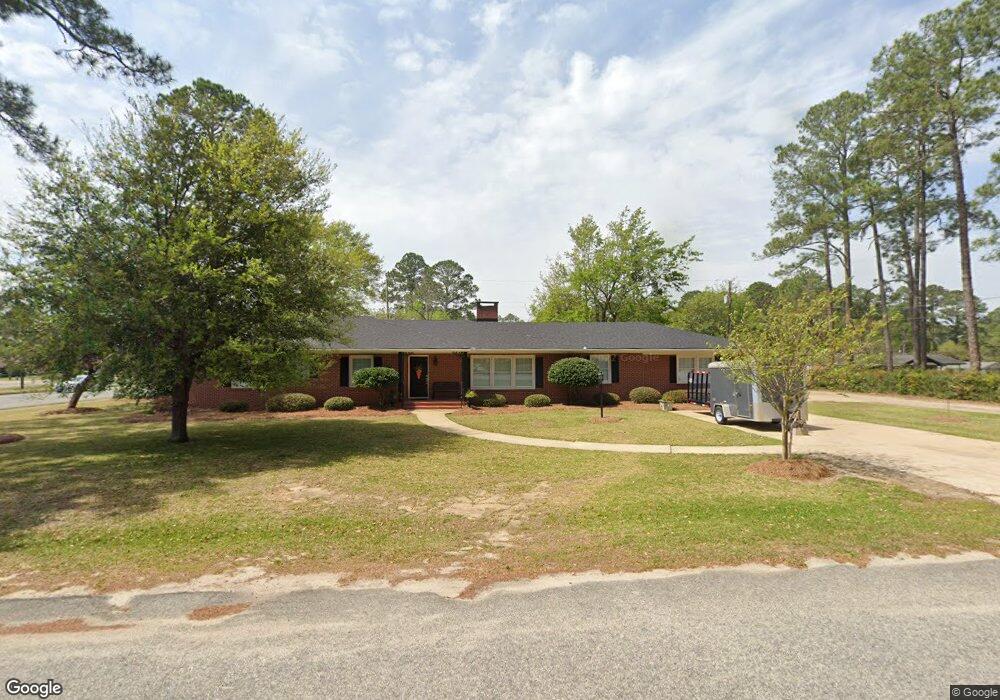
1310 Azalea Cir Cordele, GA 31015
Estimated Value: $273,210 - $287,000
4
Beds
3
Baths
2,714
Sq Ft
$103/Sq Ft
Est. Value
About This Home
This home is located at 1310 Azalea Cir, Cordele, GA 31015 and is currently estimated at $278,553, approximately $102 per square foot. 1310 Azalea Cir is a home located in Crisp County with nearby schools including Crisp County Elementary School, Crisp County Primary School, and Crisp County Middle School.
Ownership History
Date
Name
Owned For
Owner Type
Purchase Details
Closed on
Apr 29, 2022
Sold by
Hurt Beatrice C
Bought by
Jackson Vivian Jean
Current Estimated Value
Home Financials for this Owner
Home Financials are based on the most recent Mortgage that was taken out on this home.
Original Mortgage
$245,471
Outstanding Balance
$231,823
Interest Rate
4.62%
Mortgage Type
FHA
Estimated Equity
$46,730
Purchase Details
Closed on
Aug 17, 2011
Sold by
Federal Home Loan Mortgage Corporation
Bought by
Hurt Beatrice C
Purchase Details
Closed on
Apr 5, 2011
Sold by
Nesbitt James William and Nesbitt Vickie J
Bought by
Coastal States Mortgage Corporation
Purchase Details
Closed on
Dec 15, 1999
Sold by
Nesbitt Nell
Bought by
Nesbitt James Willi
Purchase Details
Closed on
May 21, 1969
Sold by
Nesbitt Thomas
Bought by
Nesbitt Nell
Purchase Details
Closed on
Jan 16, 1959
Bought by
Nesbitt Thomas
Create a Home Valuation Report for This Property
The Home Valuation Report is an in-depth analysis detailing your home's value as well as a comparison with similar homes in the area
Home Values in the Area
Average Home Value in this Area
Purchase History
| Date | Buyer | Sale Price | Title Company |
|---|---|---|---|
| Jackson Vivian Jean | $250,000 | -- | |
| Hurt Beatrice C | $73,000 | -- | |
| Coastal States Mortgage Corporation | $86,100 | -- | |
| Nesbitt James Willi | $100,000 | -- | |
| Nesbitt Nell | -- | -- | |
| Nesbitt Thomas | -- | -- |
Source: Public Records
Mortgage History
| Date | Status | Borrower | Loan Amount |
|---|---|---|---|
| Open | Jackson Vivian Jean | $245,471 |
Source: Public Records
Tax History Compared to Growth
Tax History
| Year | Tax Paid | Tax Assessment Tax Assessment Total Assessment is a certain percentage of the fair market value that is determined by local assessors to be the total taxable value of land and additions on the property. | Land | Improvement |
|---|---|---|---|---|
| 2024 | $3,389 | $95,956 | $3,034 | $92,922 |
| 2023 | $3,350 | $90,765 | $3,034 | $87,731 |
| 2022 | $2,628 | $67,287 | $3,034 | $64,253 |
| 2021 | $2,472 | $63,274 | $3,034 | $60,240 |
| 2020 | $1,725 | $63,274 | $3,034 | $60,240 |
| 2019 | $1,738 | $63,274 | $3,034 | $60,240 |
| 2018 | $1,400 | $49,498 | $5,461 | $44,037 |
| 2017 | $2,010 | $49,498 | $5,461 | $44,037 |
| 2016 | $1,405 | $49,498 | $5,461 | $44,037 |
| 2015 | -- | $49,498 | $5,461 | $44,037 |
| 2014 | -- | $49,498 | $5,461 | $44,037 |
| 2013 | -- | $49,498 | $5,461 | $44,037 |
Source: Public Records
Map
Nearby Homes
- 1311 Azalea Cir
- 1311 S Hickory St
- 1301 Azalea Cir
- 1302 Azalea Cir
- 1303 S Hickory St
- 905 E 24th Ave
- 910 Azalea Cir
- 720 E 24th Ave
- 907 E 24th Ave
- 903 Azalea Cir
- 912 Azalea Cir
- 721 E 24th Ave
- 714 E 23rd Ave
- 1212 Camellia Dr
- 1209 S Hickory St
- 723 E 25th Ave
- 716 E 24th Ave
- 1404 Fleming Rd
- 911 E 24th Ave
- 916 Azalea Cir