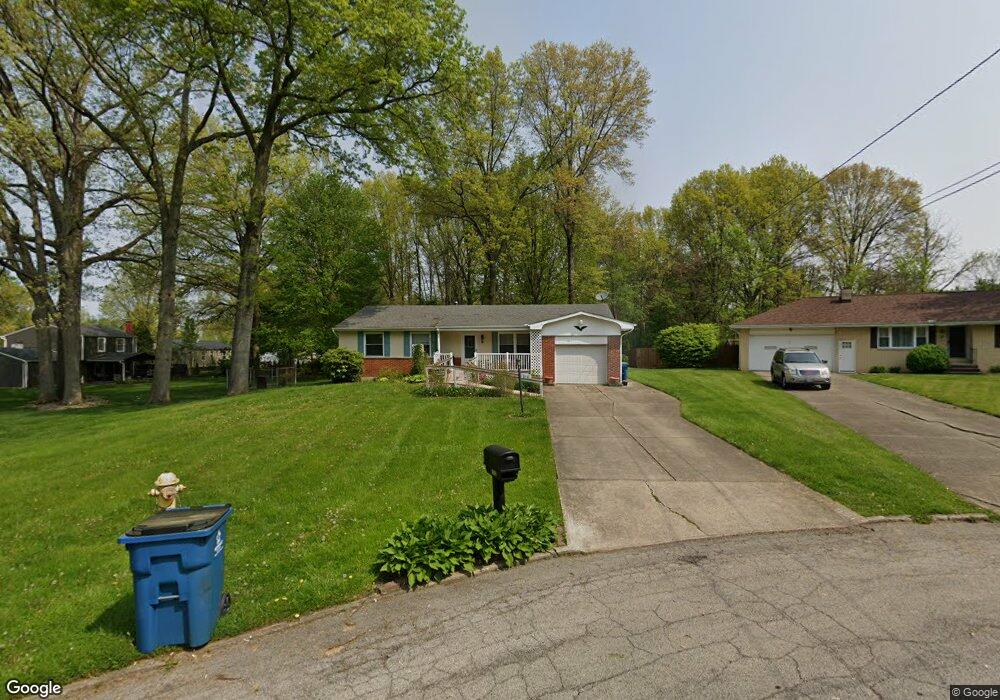
1310 Cranbrook Cir NE Warren, OH 44484
Estimated Value: $184,000 - $214,000
3
Beds
2
Baths
1,382
Sq Ft
$147/Sq Ft
Est. Value
About This Home
This home is located at 1310 Cranbrook Cir NE, Warren, OH 44484 and is currently estimated at $202,472, approximately $146 per square foot. 1310 Cranbrook Cir NE is a home located in Trumbull County with nearby schools including Howland High School, John F. Kennedy Catholic School - Lower Campus, and Holy Trinity Orthodox Christian Academy.
Ownership History
Date
Name
Owned For
Owner Type
Purchase Details
Closed on
Aug 20, 2020
Sold by
Mogle Alison G
Bought by
Rising Joshua B
Current Estimated Value
Home Financials for this Owner
Home Financials are based on the most recent Mortgage that was taken out on this home.
Original Mortgage
$103,098
Outstanding Balance
$91,455
Interest Rate
3%
Mortgage Type
FHA
Estimated Equity
$111,017
Purchase Details
Closed on
Mar 2, 2020
Sold by
Marjorie R Guthrie Revocable Trust
Bought by
Mogle Alison G
Purchase Details
Closed on
Jun 27, 2013
Sold by
Guthrie Marjorie R
Bought by
Guthrie Marjorie R
Purchase Details
Closed on
Jun 16, 2006
Sold by
Guthrie Marjorie R and Guthrie Thomas C
Bought by
Guthrie Marjorie R and Guthrie Thomas C
Purchase Details
Closed on
Jan 1, 1990
Bought by
Marjorie R Guthrie
Create a Home Valuation Report for This Property
The Home Valuation Report is an in-depth analysis detailing your home's value as well as a comparison with similar homes in the area
Home Values in the Area
Average Home Value in this Area
Purchase History
| Date | Buyer | Sale Price | Title Company |
|---|---|---|---|
| Rising Joshua B | $105,000 | None Available | |
| Mogle Alison G | -- | None Available | |
| Guthrie Marjorie R | -- | None Available | |
| Guthrie Marjorie R | -- | None Available | |
| Marjorie R Guthrie | -- | -- |
Source: Public Records
Mortgage History
| Date | Status | Borrower | Loan Amount |
|---|---|---|---|
| Open | Rising Joshua B | $103,098 |
Source: Public Records
Tax History Compared to Growth
Tax History
| Year | Tax Paid | Tax Assessment Tax Assessment Total Assessment is a certain percentage of the fair market value that is determined by local assessors to be the total taxable value of land and additions on the property. | Land | Improvement |
|---|---|---|---|---|
| 2024 | $2,710 | $51,250 | $7,600 | $43,650 |
| 2023 | $2,710 | $51,250 | $7,600 | $43,650 |
| 2022 | $2,339 | $37,210 | $7,000 | $30,210 |
| 2021 | $2,285 | $37,210 | $7,000 | $30,210 |
| 2020 | $2,349 | $37,210 | $7,000 | $30,210 |
| 2019 | $1,538 | $32,380 | $7,000 | $25,380 |
| 2018 | $1,471 | $32,380 | $7,000 | $25,380 |
| 2017 | $1,323 | $32,380 | $7,000 | $25,380 |
| 2016 | $1,226 | $30,030 | $7,000 | $23,030 |
| 2015 | $1,195 | $30,030 | $7,000 | $23,030 |
| 2014 | $1,154 | $30,030 | $7,000 | $23,030 |
| 2013 | $1,147 | $30,030 | $7,000 | $23,030 |
Source: Public Records
Map
Nearby Homes
- 7979 Brookwood St NE
- 8531 Red Oak Dr NE
- 108 Westwind Dr NE
- 8545 Carriage Hill Dr NE
- 741 Shady Ln NE
- 0 King Graves Rd NE
- 7707 Raglan Dr NE
- 7751 Castle Rock Dr NE
- 610 Clifton Dr NE
- 7837 Raglan Dr NE
- 8848 King Graves Rd NE
- 8528 Deer Creek Ln NE
- 7697 Micawber Rd NE
- 660 Rosegarden Dr NE
- 1750 Portal Dr NE
- 2133 Silver Fox Ln NE
- 106 N Aspen Ct Unit 4
- 248 Darlington Rd NE
- 4167 N River Rd NE
- 126 N Aspen Ct Unit 2
- 1326 Cranbrook Dr NE
- 1306 Cranbrook Cir NE
- 1342 Cranbrook Dr NE
- 1312 Cranbrook Cir NE
- 1296 Cranbrook Cir NE
- 1374 Cranbrook Dr NE
- 1290 Cranbrook Cir NE
- 1268 Cranbrook Cir NE
- 1323 Cranbrook Ave NE
- 1390 Cranbrook Dr NE
- 1323 Cranbrook Dr NE
- 1278 Cranbrook Cir NE
- 1355 Niles Cortland Rd NE
- 1337 Niles Cortland Rd NE
- 1315 Niles Cortland Rd NE
- 1341 Cranbrook Dr NE
- 1305 Cranbrook Dr NE
- 1284 Cranbrook Cir NE
- 1359 Cranbrook Dr NE
- 1297 Niles Cortland Rd NE