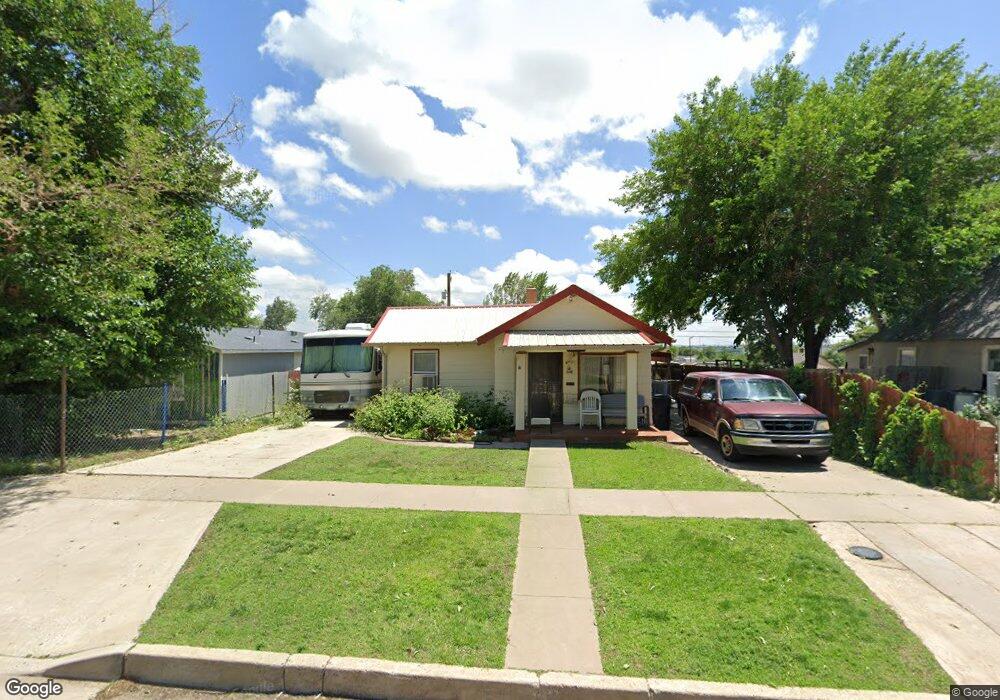
1310 E 3rd St Pueblo, CO 81001
Lower East Side NeighborhoodEstimated Value: $180,000 - $214,000
3
Beds
2
Baths
1,408
Sq Ft
$142/Sq Ft
Est. Value
About This Home
This home is located at 1310 E 3rd St, Pueblo, CO 81001 and is currently estimated at $199,937, approximately $142 per square foot. 1310 E 3rd St is a home located in Pueblo County with nearby schools including Bradford Elementary School, Risley International Academy of Innovation, and East High School.
Ownership History
Date
Name
Owned For
Owner Type
Purchase Details
Closed on
May 22, 2016
Sold by
Sandoval Michael Ray and Sandoval Michael R
Bought by
Sandoval Louis J and Garcia Luann M
Current Estimated Value
Purchase Details
Closed on
Jul 22, 1998
Sold by
Sandoval L J + L O L and Sandoval Garcia L
Bought by
Sandoval L J + L O(Life Estate
Purchase Details
Closed on
May 15, 1998
Sold by
Sandoval Lj
Bought by
Garcia Lo + and Garcia Lm
Purchase Details
Closed on
Jun 5, 1995
Sold by
Sandoval Louis J + Lydia O
Bought by
Sandoval Lj
Purchase Details
Closed on
Aug 25, 1975
Sold by
Greiner Madeline E
Bought by
Sandoval Louis J + Lydia O
Create a Home Valuation Report for This Property
The Home Valuation Report is an in-depth analysis detailing your home's value as well as a comparison with similar homes in the area
Home Values in the Area
Average Home Value in this Area
Purchase History
| Date | Buyer | Sale Price | Title Company |
|---|---|---|---|
| Sandoval Louis J | -- | None Available | |
| Sandoval L J + L O(Life Estate | -- | -- | |
| Garcia Lo + | -- | -- | |
| Sandoval Lj | -- | -- | |
| Sandoval Louis J + Lydia O | $11,300 | -- |
Source: Public Records
Tax History
| Year | Tax Paid | Tax Assessment Tax Assessment Total Assessment is a certain percentage of the fair market value that is determined by local assessors to be the total taxable value of land and additions on the property. | Land | Improvement |
|---|---|---|---|---|
| 2024 | $455 | $8,990 | -- | -- |
| 2023 | $461 | $12,680 | $1,010 | $11,670 |
| 2022 | $393 | $7,770 | $400 | $7,370 |
| 2021 | $405 | $7,990 | $410 | $7,580 |
| 2020 | $319 | $7,380 | $410 | $6,970 |
| 2019 | $319 | $6,213 | $255 | $5,958 |
| 2018 | $211 | $4,556 | $256 | $4,300 |
| 2017 | $213 | $4,556 | $256 | $4,300 |
| 2016 | $205 | $4,445 | $283 | $4,162 |
| 2015 | $102 | $4,445 | $283 | $4,162 |
| 2014 | $110 | $4,793 | $283 | $4,510 |
Source: Public Records
Map
Nearby Homes
Your Personal Tour Guide
Ask me questions while you tour the home.