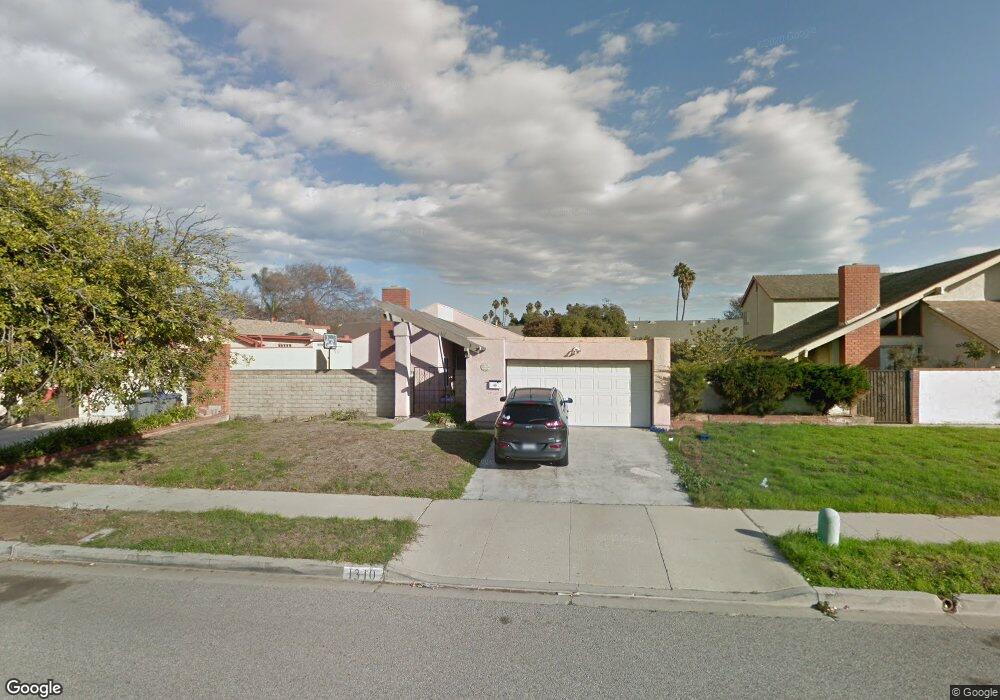
1310 Los Prietos Ct Oxnard, CA 93035
Marina West NeighborhoodEstimated Value: $554,000 - $798,000
4
Beds
2
Baths
1,548
Sq Ft
$451/Sq Ft
Est. Value
About This Home
This home is located at 1310 Los Prietos Ct, Oxnard, CA 93035 and is currently estimated at $698,795, approximately $451 per square foot. 1310 Los Prietos Ct is a home located in Ventura County with nearby schools including Marina West Elementary School, Oxnard High School, and New Harvest Christian School.
Ownership History
Date
Name
Owned For
Owner Type
Purchase Details
Closed on
Jun 22, 2012
Sold by
Melendez Noe J and Melendez Guadalupe H
Bought by
Melendez Noe J and Melendez Guadalupe H
Current Estimated Value
Purchase Details
Closed on
Dec 28, 2009
Sold by
Melendez Noe J and Melendez Guadalupe H
Bought by
Melendez Noe J and Melendez Guadalupe H
Purchase Details
Closed on
Mar 26, 2007
Sold by
Melendez Noe J and Melendez Guadalupe H
Bought by
Melendez Noe J and Melendez Guadalupe H
Home Financials for this Owner
Home Financials are based on the most recent Mortgage that was taken out on this home.
Original Mortgage
$58,500
Interest Rate
6.13%
Mortgage Type
Stand Alone Second
Purchase Details
Closed on
Jun 7, 2005
Sold by
Melendez Noe J and Melendez Guadalupe H
Bought by
Melendez Noe J and Melendez Guadalupe H
Create a Home Valuation Report for This Property
The Home Valuation Report is an in-depth analysis detailing your home's value as well as a comparison with similar homes in the area
Home Values in the Area
Average Home Value in this Area
Purchase History
| Date | Buyer | Sale Price | Title Company |
|---|---|---|---|
| Melendez Noe J | -- | None Available | |
| Melendez Noe J | -- | None Available | |
| Melendez Noe J | -- | First American Title Company | |
| Melendez Noe J | -- | First American Title Company | |
| Melendez Noe J | -- | -- |
Source: Public Records
Mortgage History
| Date | Status | Borrower | Loan Amount |
|---|---|---|---|
| Closed | Melendez Noe J | $58,500 | |
| Closed | Melendez Noe J | $468,000 |
Source: Public Records
Tax History
| Year | Tax Paid | Tax Assessment Tax Assessment Total Assessment is a certain percentage of the fair market value that is determined by local assessors to be the total taxable value of land and additions on the property. | Land | Improvement |
|---|---|---|---|---|
| 2025 | $1,759 | $148,929 | $24,210 | $124,719 |
| 2024 | $1,759 | $146,009 | $23,735 | $122,274 |
| 2023 | $1,695 | $143,147 | $23,270 | $119,877 |
| 2022 | $1,643 | $140,341 | $22,814 | $117,527 |
| 2021 | $1,628 | $137,590 | $22,367 | $115,223 |
| 2020 | $1,657 | $136,182 | $22,139 | $114,043 |
| 2019 | $1,609 | $133,512 | $21,705 | $111,807 |
| 2018 | $1,586 | $130,895 | $21,280 | $109,615 |
| 2017 | $1,505 | $128,329 | $20,863 | $107,466 |
| 2016 | $1,452 | $125,813 | $20,454 | $105,359 |
| 2015 | $1,466 | $123,925 | $20,148 | $103,777 |
| 2014 | $1,448 | $121,500 | $19,754 | $101,746 |
Source: Public Records
Map
Nearby Homes
- 1501 Pisco Ln
- 2213 Miramar Walk
- 2324 Miramar Walk
- 257 E Garden Green
- 137 E Garden Green
- 13 W Garden Green
- 269 E Elfin Green
- 1720 Elsinore Cir
- 20 W Fiesta Green
- 2400 W Hemlock St
- 75 W Fiesta Green
- 236 E Bay Blvd
- 2730 Jill Place
- 31 W Delta Green
- 2715 Jill Place
- 1431 Casa San Carlos Ln Unit B
- 2783 Bolker Dr
- 2706 Bolker Dr
- 1174 Oyster Place Unit 15
- 1309 Nautical Way
- 1320 Los Prietos Ct
- 1300 Los Prietos Ct
- 1311 Descanso Ct
- 1321 Descanso Ct
- 1330 Los Prietos Ct
- 1301 Descanso Ct
- 1331 Descanso Ct
- 1311 Los Prietos Ct
- 1301 Los Prietos Ct
- 1321 Los Prietos Ct
- 1261 Callas Dr
- 1721 W Birch St
- 1711 W Birch St
- 1331 Los Prietos Ct
- 1721 Hill St
- 1731 W Birch St
- 1701 W Birch St
- 1711 Hill St
- 1801 W Birch St
- 1251 Callas Dr
Your Personal Tour Guide
Ask me questions while you tour the home.