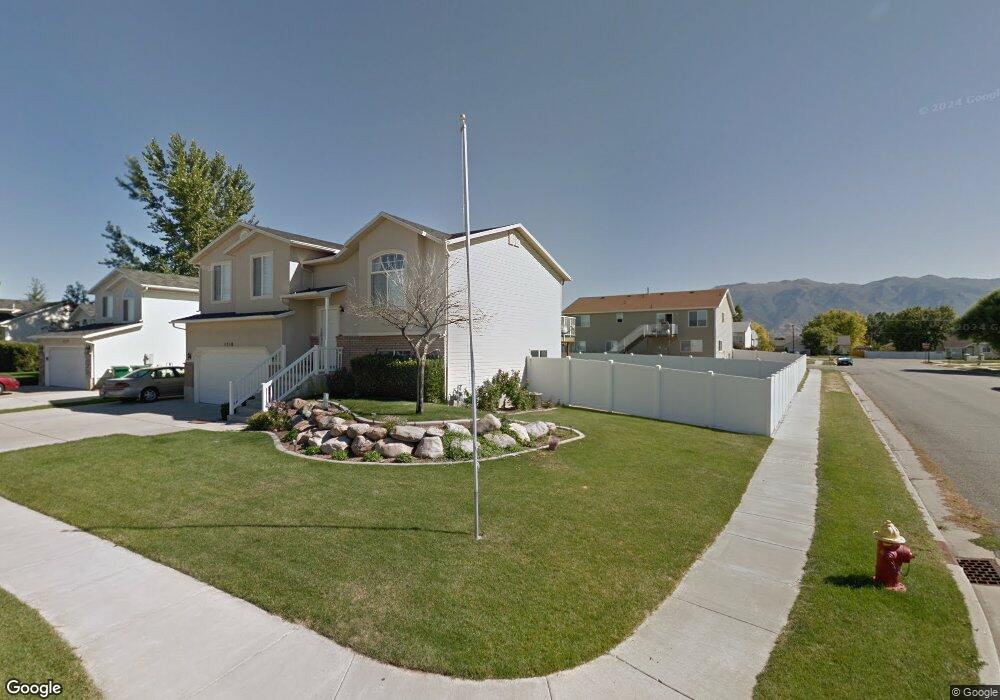
1310 N 2275 W Layton, UT 84041
Estimated Value: $441,149 - $480,000
3
Beds
2
Baths
1,178
Sq Ft
$384/Sq Ft
Est. Value
About This Home
This home is located at 1310 N 2275 W, Layton, UT 84041 and is currently estimated at $452,787, approximately $384 per square foot. 1310 N 2275 W is a home with nearby schools including Ellison Park School, Shoreline Junior High School, and Layton High School.
Ownership History
Date
Name
Owned For
Owner Type
Purchase Details
Closed on
Aug 20, 2013
Sold by
Burnside Wade R
Bought by
Burnside Jamie W
Current Estimated Value
Purchase Details
Closed on
Sep 19, 2005
Sold by
Sorensen Jason M and Sorensen Amy L
Bought by
Burnside Wade R
Home Financials for this Owner
Home Financials are based on the most recent Mortgage that was taken out on this home.
Original Mortgage
$155,000
Outstanding Balance
$82,456
Interest Rate
5.76%
Mortgage Type
Fannie Mae Freddie Mac
Estimated Equity
$370,331
Purchase Details
Closed on
Apr 24, 2000
Sold by
Woodside Homes Corp
Bought by
Sorensen Jason M and Sorensen Amy L
Home Financials for this Owner
Home Financials are based on the most recent Mortgage that was taken out on this home.
Original Mortgage
$137,097
Interest Rate
8.24%
Mortgage Type
FHA
Create a Home Valuation Report for This Property
The Home Valuation Report is an in-depth analysis detailing your home's value as well as a comparison with similar homes in the area
Home Values in the Area
Average Home Value in this Area
Purchase History
| Date | Buyer | Sale Price | Title Company |
|---|---|---|---|
| Burnside Jamie W | -- | None Available | |
| Burnside Wade R | -- | Backman Title Services | |
| Sorensen Jason M | -- | First American Title Co |
Source: Public Records
Mortgage History
| Date | Status | Borrower | Loan Amount |
|---|---|---|---|
| Open | Burnside Wade R | $155,000 | |
| Previous Owner | Sorensen Jason M | $137,097 |
Source: Public Records
Tax History Compared to Growth
Tax History
| Year | Tax Paid | Tax Assessment Tax Assessment Total Assessment is a certain percentage of the fair market value that is determined by local assessors to be the total taxable value of land and additions on the property. | Land | Improvement |
|---|---|---|---|---|
| 2025 | $2,180 | $228,800 | $103,491 | $125,309 |
| 2024 | $2,101 | $222,200 | $114,866 | $107,334 |
| 2023 | $2,017 | $376,000 | $112,890 | $263,110 |
| 2022 | $2,223 | $224,950 | $71,119 | $153,831 |
| 2021 | $1,961 | $296,000 | $106,707 | $189,293 |
| 2020 | $1,761 | $255,000 | $89,606 | $165,394 |
| 2019 | $1,819 | $258,000 | $92,498 | $165,502 |
| 2018 | $1,622 | $231,000 | $81,065 | $149,935 |
| 2016 | $1,420 | $104,335 | $31,564 | $72,771 |
| 2015 | $1,433 | $99,935 | $31,564 | $68,371 |
| 2014 | $1,442 | $102,843 | $31,564 | $71,279 |
| 2013 | -- | $97,775 | $28,952 | $68,823 |
Source: Public Records
Map
Nearby Homes
- 1430 N 2100 W
- 2115 W 1225 N
- 2438 W 1400 N
- 1477 N 2375 W
- 1491 N 1875 W
- 1491 N 1875 W Unit 158
- 1487 N 1875 W
- 1487 N 1875 W Unit 159
- 1483 N 1875 W
- 1479 N 1875 W
- 1479 N 1875 W Unit 161
- 1452 N 1875 W Unit 146
- 1463 N 1875 W Unit 165
- 1463 N 1875 W
- 1459 N 1875 W
- 1459 N 1875 W Unit 166
- 1455 N 1875 W Unit 167
- 1451 N 1875 W Unit 168
- 1476 N 1875 W Unit 164
- 2114 S 825 E