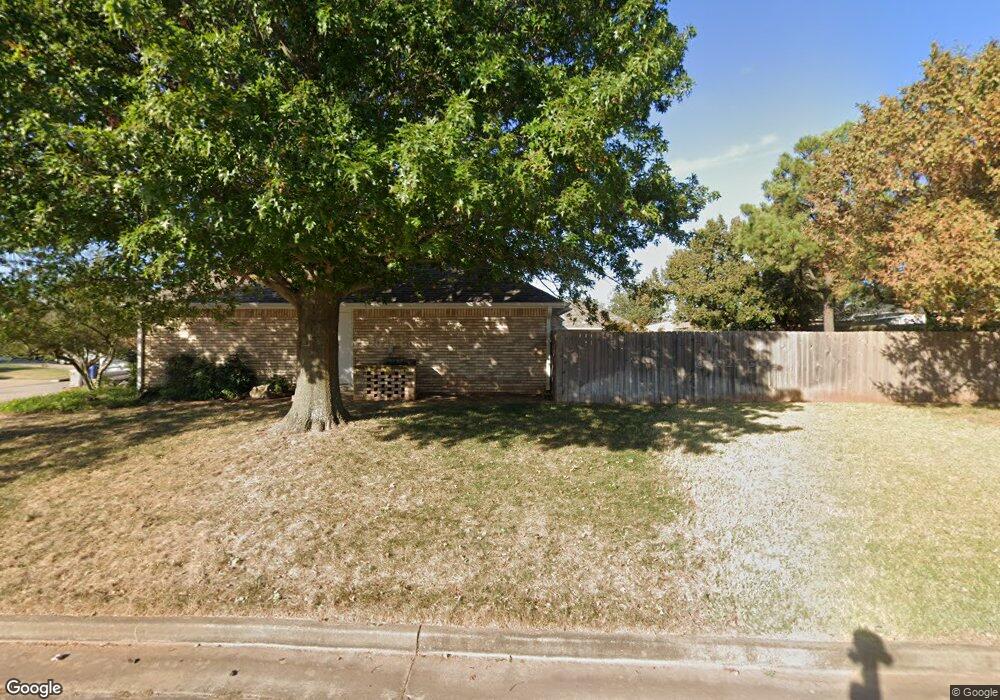
1310 Nottingham Cir Shawnee, OK 74804
Estimated Value: $297,505 - $392,000
4
Beds
3
Baths
2,602
Sq Ft
$133/Sq Ft
Est. Value
About This Home
This home is located at 1310 Nottingham Cir, Shawnee, OK 74804 and is currently estimated at $346,376, approximately $133 per square foot. 1310 Nottingham Cir is a home located in Pottawatomie County.
Ownership History
Date
Name
Owned For
Owner Type
Purchase Details
Closed on
Jun 13, 2019
Sold by
Mcmurry Tony M Mcmurry and Mcmurry Nannette Shadid
Bought by
Tony Mcmurry & Nannette Shadid Mcmurry 2
Current Estimated Value
Purchase Details
Closed on
Feb 2, 2010
Sold by
Mcmurry Tony M and Mcmurry Nannette S
Bought by
The Tony M & Nannette Shadid Mcmurry 200
Purchase Details
Closed on
Jan 27, 1997
Sold by
Mike D Little Const
Bought by
Mcmurry Tony and Mcmurry Nannette
Purchase Details
Closed on
Aug 20, 1996
Sold by
Shawnee Dev Corp
Bought by
Mike D Little Const
Create a Home Valuation Report for This Property
The Home Valuation Report is an in-depth analysis detailing your home's value as well as a comparison with similar homes in the area
Home Values in the Area
Average Home Value in this Area
Purchase History
| Date | Buyer | Sale Price | Title Company |
|---|---|---|---|
| Tony Mcmurry & Nannette Shadid Mcmurry 2 | -- | None Available | |
| The Tony M & Nannette Shadid Mcmurry 200 | -- | None Available | |
| Mcmurry Tony | $188,500 | -- | |
| Mike D Little Const | $27,500 | -- |
Source: Public Records
Tax History Compared to Growth
Tax History
| Year | Tax Paid | Tax Assessment Tax Assessment Total Assessment is a certain percentage of the fair market value that is determined by local assessors to be the total taxable value of land and additions on the property. | Land | Improvement |
|---|---|---|---|---|
| 2024 | $2,692 | $30,205 | $3,420 | $26,785 |
| 2023 | $2,692 | $29,325 | $3,420 | $25,905 |
| 2022 | $2,641 | $29,325 | $3,420 | $25,905 |
| 2021 | $2,665 | $29,325 | $3,420 | $25,905 |
| 2020 | $2,694 | $29,683 | $3,382 | $26,301 |
| 2019 | $2,642 | $28,818 | $3,246 | $25,572 |
| 2018 | $2,577 | $27,979 | $3,109 | $24,870 |
| 2017 | $2,479 | $27,165 | $2,986 | $24,179 |
| 2016 | $2,430 | $26,374 | $2,867 | $23,507 |
| 2015 | $2,081 | $25,605 | $2,768 | $22,837 |
| 2014 | $2,018 | $24,860 | $2,697 | $22,163 |
Source: Public Records
Map
Nearby Homes
- 1309 Nottingham Cir
- 1305 Castle Creek St
- 1301 Manchester
- 13 Brentwood Place
- 64 Northridge Rd
- 3 Norwich Ct
- 2 Lancet Cir
- 6 Lancet Ct
- 43138 Rain Rd
- 43147 Rain Rd
- 0000 N Rd
- 0000 N Ridge Road Block 2 Lot 4 Rd
- 0000 Maple Grove Avenue Block 2 Lot 29 Ave
- 0000 Maple Grove Avenue Block 2 Lot 28 Ave
- 0000 N Rd
- 0000 Maple Grove Avenue Block 2 Lot 27 Ave
- 0000 N Ridge Road Block 1 Lot 3 Rd
- 0000 N Ridge Road Block 1 Lot 4 Rd
- 0000 N Ridge Road Block 2 Lot 6 Rd
- 0000 N Rd
- 1308 Nottingham Cir
- 1311 Cambridge Dr
- 1301 Nottingham Cir
- 1309 Cambridge Dr
- 2905 Crown Point
- 1306 Nottingham Cir
- 1402 Nottingham Place
- 1307 Nottingham Cir
- 1307 Cambridge Dr
- 1400 Nottingham Place
- 2903 Crown Point
- 1304 Nottingham Cir
- 1305 Nottingham Cir
- 1305 Cambridge Dr
- 1403 Nottingham Place
- 1310 Cambridge Dr
- 1303 Nottingham Cir
- 1312 Castle Creek St
- 1404 Nottingham Place
- 2901 Crown Point