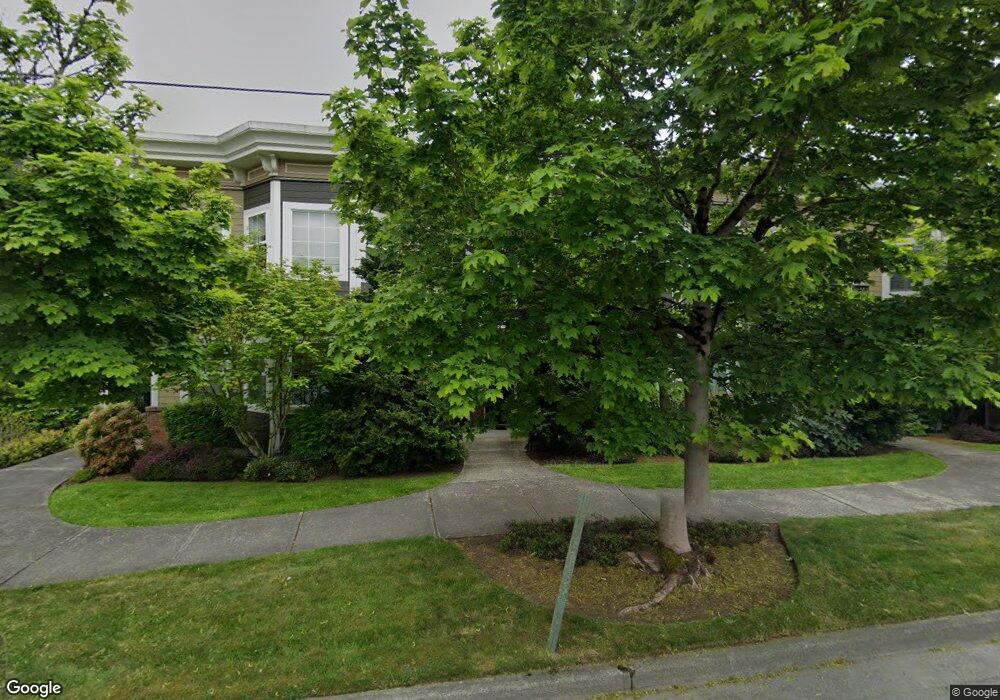
1310 Old Fairhvn Pkwy Unit 101 Bellingham, WA 98225
Fairhaven NeighborhoodEstimated Value: $654,000 - $771,000
2
Beds
2
Baths
1,460
Sq Ft
$479/Sq Ft
Est. Value
About This Home
This home is located at 1310 Old Fairhvn Pkwy Unit 101, Bellingham, WA 98225 and is currently estimated at $699,348, approximately $479 per square foot. 1310 Old Fairhvn Pkwy Unit 101 is a home located in Whatcom County with nearby schools including Lowell Elementary School, Fairhaven Middle School, and Sehome High School.
Ownership History
Date
Name
Owned For
Owner Type
Purchase Details
Closed on
Apr 3, 2019
Sold by
Fleetwood Seth and The Estate Of Jack Bernstein
Bought by
Chaikin Ann Mcmillan
Current Estimated Value
Purchase Details
Closed on
Feb 1, 2013
Sold by
Quan Rosita
Bought by
Gehler Martha
Purchase Details
Closed on
Feb 24, 2012
Sold by
Quan Rosita
Bought by
Quan Rosita
Purchase Details
Closed on
Feb 7, 2007
Sold by
Risser John
Bought by
Bernstein Jack
Purchase Details
Closed on
Aug 22, 2006
Sold by
Quan Jing and Quan Rosita
Bought by
Quan Jing G and Quan Rosita
Purchase Details
Closed on
Dec 2, 2004
Sold by
12Th Street Village Llc
Bought by
Quan Jing and Quan Rosita
Home Financials for this Owner
Home Financials are based on the most recent Mortgage that was taken out on this home.
Original Mortgage
$175,000
Interest Rate
5.76%
Mortgage Type
Balloon
Create a Home Valuation Report for This Property
The Home Valuation Report is an in-depth analysis detailing your home's value as well as a comparison with similar homes in the area
Home Values in the Area
Average Home Value in this Area
Purchase History
| Date | Buyer | Sale Price | Title Company |
|---|---|---|---|
| Chaikin Ann Mcmillan | $435,000 | Chicago Title Insurance | |
| Gehler Martha | $310,280 | Chicago Title Insurance | |
| Quan Rosita | -- | None Available | |
| Bernstein Jack | $379,000 | Chicago Title Insurance | |
| Quan Jing G | -- | None Available | |
| Quan Jing | $269,950 | Whatcom Land Title |
Source: Public Records
Mortgage History
| Date | Status | Borrower | Loan Amount |
|---|---|---|---|
| Previous Owner | Quan Jing | $175,000 |
Source: Public Records
Tax History Compared to Growth
Tax History
| Year | Tax Paid | Tax Assessment Tax Assessment Total Assessment is a certain percentage of the fair market value that is determined by local assessors to be the total taxable value of land and additions on the property. | Land | Improvement |
|---|---|---|---|---|
| 2024 | $5,140 | $660,387 | $220,129 | $440,258 |
| 2023 | $5,140 | $660,387 | $220,129 | $440,258 |
| 2022 | $4,543 | $574,236 | $191,412 | $382,824 |
| 2021 | $4,278 | $486,642 | $162,214 | $324,428 |
| 2020 | $4,082 | $423,150 | $141,050 | $282,100 |
| 2019 | $3,884 | $390,000 | $130,000 | $260,000 |
| 2018 | $4,079 | $372,128 | $119,618 | $252,510 |
| 2017 | $3,743 | $335,489 | $107,824 | $227,665 |
| 2016 | $3,458 | $321,341 | $105,064 | $216,277 |
| 2015 | $3,256 | $309,324 | $100,924 | $208,400 |
| 2014 | -- | $281,800 | $92,000 | $189,800 |
| 2013 | -- | $281,800 | $92,000 | $189,800 |
Source: Public Records
Map
Nearby Homes
- 1212 Old Fairhaven Pkwy Unit D202
- 1302 Larrabee Ave
- 1605 Donovan Ave
- 1315 Mill Ave
- 910 Harris Ave Unit 208
- 910 Harris Ave Unit 304
- 707 Donovan Ave
- 1100 12th St
- 1902 Wilson Ave
- 331 Chuckanut Dr N
- 1014 11th St Unit 302
- 214 Bayside Rd
- 1005 15th St
- 425 Chuckanut Dr N Unit 5
- 917 13th St
- 903 13th St
- 406 Willow Road Place
- 404 Willow Road Place
- 2600 16th St
- 1301 Broad St
- 1310 Old Fairhaven Pkwy Unit 101
- 1310 Old Fairhaven Pkwy Unit 202
- 1310 Old Fairhaven Pkwy Unit 103
- 1310 Old Fairhaven Pkwy Unit 201
- 1310 Old Fairhaven Pkwy Unit 203
- 1310 Old Fairhvn Pkwy Unit 203
- 1310 Old Fairhvn Pkwy Unit 202
- 1310 Old Fairhvn Pkwy Unit 201
- 1310 Old Fairhvn Pkwy Unit 103
- 1310 Old Fairhvn Pkwy Unit 102
- 1310 Old Fairhaven Pkwy
- 1306 Old Fairhaven Pkwy Unit 202
- 1306 Old Fairhaven Pkwy Unit 201
- 1306 Old Fairhaven Pkwy Unit B102
- 1306 Old Fairhaven Pkwy Unit 302
- 1306 Old Fairhvn Pkwy Unit 302
- 1306 Old Fairhvn Pkwy Unit 301
- 1306 Old Fairhvn Pkwy Unit 202
- 1306 Old Fairhvn Pkwy Unit 201
- 1306 Old Fairhvn Pkwy Unit 102