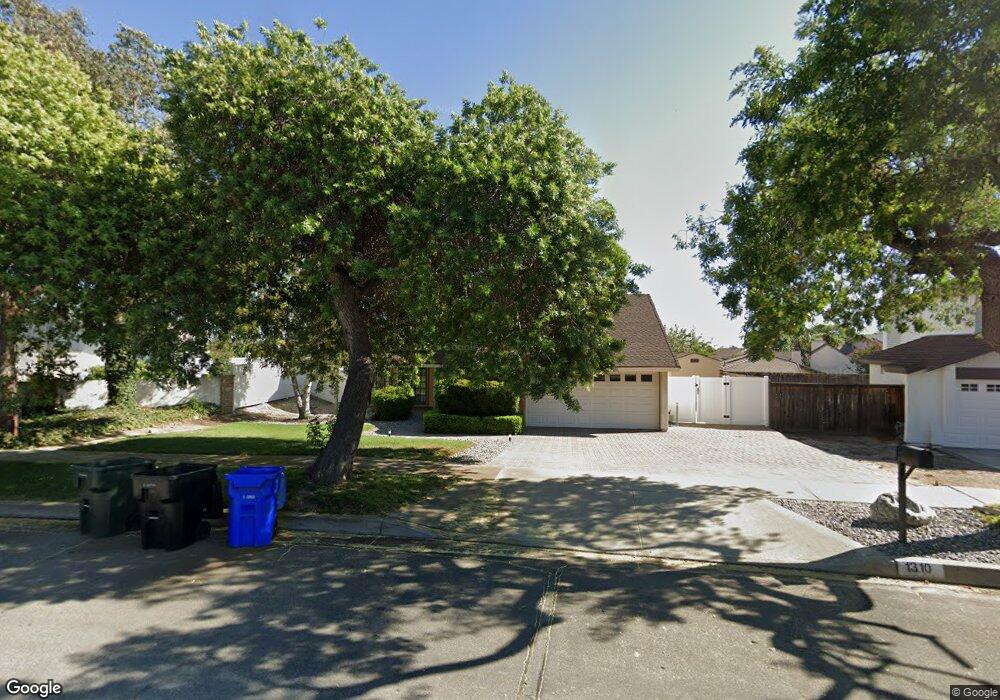
1310 W Clark St Upland, CA 91784
Estimated Value: $850,000 - $961,000
4
Beds
3
Baths
2,068
Sq Ft
$434/Sq Ft
Est. Value
About This Home
This home is located at 1310 W Clark St, Upland, CA 91784 and is currently estimated at $896,518, approximately $433 per square foot. 1310 W Clark St is a home located in San Bernardino County with nearby schools including Pepper Tree Elementary, Pioneer Junior High School, and Upland High School.
Ownership History
Date
Name
Owned For
Owner Type
Purchase Details
Closed on
Nov 16, 2000
Sold by
Bennett Gary A
Bought by
Peel Richard V and Peel Katawnya C
Current Estimated Value
Home Financials for this Owner
Home Financials are based on the most recent Mortgage that was taken out on this home.
Original Mortgage
$224,000
Outstanding Balance
$82,422
Interest Rate
7.86%
Estimated Equity
$814,096
Purchase Details
Closed on
Nov 11, 2000
Sold by
Bennett Gary A and Bennett Cynthia Lee
Bought by
Peel Richard V and Peel Katawnya C
Home Financials for this Owner
Home Financials are based on the most recent Mortgage that was taken out on this home.
Original Mortgage
$224,000
Outstanding Balance
$82,422
Interest Rate
7.86%
Estimated Equity
$814,096
Create a Home Valuation Report for This Property
The Home Valuation Report is an in-depth analysis detailing your home's value as well as a comparison with similar homes in the area
Home Values in the Area
Average Home Value in this Area
Purchase History
| Date | Buyer | Sale Price | Title Company |
|---|---|---|---|
| Peel Richard V | -- | First American Title Ins Co | |
| Peel Richard V | $280,000 | First American Title Ins Co |
Source: Public Records
Mortgage History
| Date | Status | Borrower | Loan Amount |
|---|---|---|---|
| Open | Peel Richard V | $224,000 | |
| Closed | Peel Richard V | $42,000 |
Source: Public Records
Tax History
| Year | Tax Paid | Tax Assessment Tax Assessment Total Assessment is a certain percentage of the fair market value that is determined by local assessors to be the total taxable value of land and additions on the property. | Land | Improvement |
|---|---|---|---|---|
| 2025 | $4,897 | $444,080 | $147,672 | $296,408 |
| 2024 | $4,740 | $435,372 | $144,776 | $290,596 |
| 2023 | $4,667 | $426,835 | $141,937 | $284,898 |
| 2022 | $4,565 | $418,466 | $139,154 | $279,312 |
| 2021 | $4,558 | $410,260 | $136,425 | $273,835 |
| 2020 | $4,433 | $406,053 | $135,026 | $271,027 |
| 2019 | $4,417 | $398,091 | $132,378 | $265,713 |
| 2018 | $4,309 | $390,285 | $129,782 | $260,503 |
| 2017 | $4,183 | $382,632 | $127,237 | $255,395 |
| 2016 | $3,974 | $375,129 | $124,742 | $250,387 |
| 2015 | $3,882 | $369,494 | $122,868 | $246,626 |
| 2014 | $3,781 | $362,256 | $120,461 | $241,795 |
Source: Public Records
Map
Nearby Homes
- 1238 Fairway Cir
- 1798 Wilson Ave
- 1830 Wilson Ave
- 1631 Carmel Cir E
- 1640 Lakewood Ave
- 1614 Carmel Cir W
- 1613 Erin Ave
- 1611 N Kelly Ave
- 1243 Jacaranda Place
- 1567 Brentwood Ave
- 1931 Eloise Way
- 1671 N Rocky Rd
- 1705 Almond Tree Place
- 1647 Purple Heart Place
- 1582 Foxdale Ct
- 1742 N Albright Ave
- 1520 Cantabria Place
- 1267 Preston Ct
- 1496 Lemon Grove Dr
- 1669 N San Antonio Ave
- 1328 W Clark St
- 1300 W Clark St
- 1290 Celia Ct
- 1320 N North Hills Dr
- 1308 N North Hills Dr
- 1336 W Clark St
- 1326 N North Hills Dr
- 1294 Shadow Cir
- 1311 W Clark St
- 1329 W Clark St
- 1332 N North Hills Dr
- 1296 Shadow Cir
- 1280 Celia Ct
- 1297 W Clark St
- 1335 W Clark St
- 1324 Shadow Cir
- 1344 W Clark St
- 1336 N North Hills Dr
- 1298 Shadow Cir
- 1268 Celia Ct
Your Personal Tour Guide
Ask me questions while you tour the home.