NOT LISTED FOR SALE

1310 W Glenn Ave Unit 1 Springfield, IL 62704

Estimated Value: $141,000 - $157,000

3 Beds
2 Baths
1,200 Sq Ft
$125/Sq Ft Est. Value

Last Sold July 19, 2013

Last sale price $89,000 $74 Per Sq Ft

Est. 68% increase in value since last sale

Current estimated payment $1,062/month

4 Days on Market

About This Home

As of July 2013

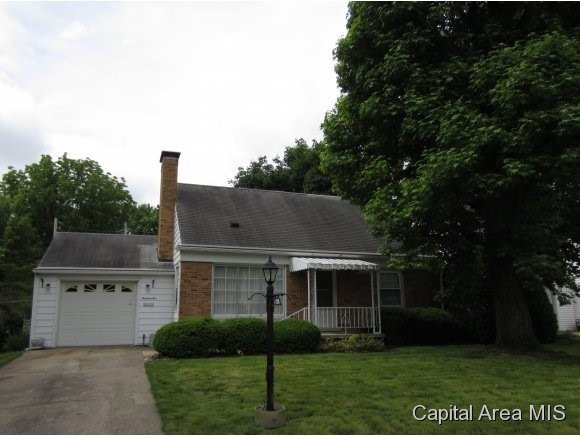
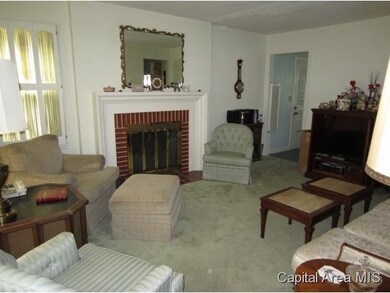
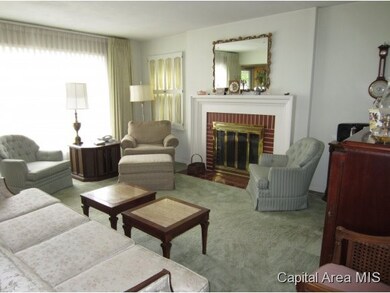
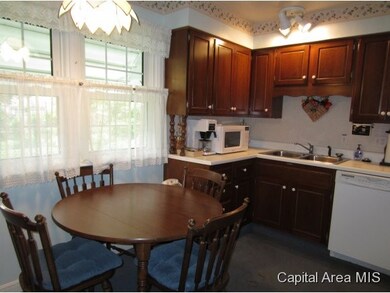
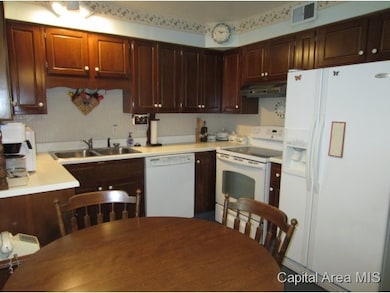
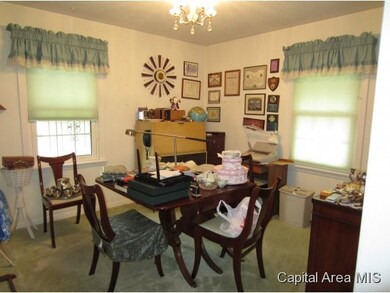
Nice Cape Cod with attached garage in popular Jerome. Newer cabinets in kitchen. Two full baths. Nice screened in porch behind garage. Private yard. New windows. Dining room has closet and could be 4th bedroom.

Last Agent to Sell the Property

GRADY BROKER

GRADY REALTORS, INC. Listed on: 05/31/2013

Last Buyer's Agent

Malinda Ratliff

IN BETWEEN OFFICES License #475103248

Home Details

Home Type

  • Single Family

Est. Annual Taxes

  • $1,956

Year Built

  • Built in 1951

Lot Details

  • 8,102

Kitchen

  • Oven or Range
  • Dishwasher

Bedrooms and Bathrooms

  • 2 Full Bathrooms

Home Details

Home Type

Single Family

Est. Annual Taxes

$1,956

Year Built

Built in 1951

Lot Details

0

Listing Details

  • Class: Residential
  • Type: Single Family
  • Unit Style: 1-Level
  • Legal Description: JOHN B. CROSBYS GLENN AVE SUB L 1
  • Year Built: 1951
  • Special Features: None
  • Property Sub Type: Detached

Interior Features

  • Appliances: Dishwasher, Refrigerator, Range/Oven
  • Fireplace: Wood Burning, Living Room
  • Number Fireplaces: 1
  • Total Bathrooms: 2
  • Total Full Baths: 2
  • Bedrooms: 3
  • Master Bedroom: Dimensions: 13x11.2, On Level: Main, Flooring: Carpet
  • Basement Foundation: Full, Block, Unfinished
  • Bedroom 2: Dimensions: 12.9x11, On Level: Upper, Flooring: Tile
  • Bedroom 3: Dimensions: 15x14.4, On Level: Upper, Flooring: Tile
  • Den: Dimensions: 15.9x13, On Level: Main, Flooring: Carpet
  • Formal Dining Room: Dimensions: 10.8x11.2, On Level: Main, Flooring: Carpet
  • Kitchen: Dimensions: 11.1x10, On Level: Main, Flooring: Carpet
  • Kitchen Dining: Eat-In Kitchen
  • Living Room: Dimensions: 16.6x12.7, On Level: Main, Flooring: Carpet
  • Total Basement Sq Ft: 750
  • Price Per Sq Ft: 74.17
  • Finished Sq Ft: 1200
  • Total Sq Ft: 1200
  • Finished Main Level Sq Ft: 1200

Exterior Features

  • Exterior: Brick, Vinyl Siding
  • Exterior Amenities: Porch/Screened

Garage/Parking

  • Garage Parking: Attached
  • Number Cars: 1

Utilities

  • Heating Cooling: Gas, Forced Air, Central Air
  • Water Sewer: Public Water, Public Sewer
  • Utility Companies: Cwlp,Ameren Illinois

Schools

  • High School: Springfield District #186

Lot Info

  • Estimated Lot Size: 62.5 x 130
  • Lot Description: Level
  • Subdivision: Jerome
  • Geo Subdivision: IL

Tax Info

  • Annual Taxes: 1956
  • Parcel Id Number Tax Id: 22080204013
  • Tax Exemptions: Homestead Improvement, Senior Homestead
  • Tax Year: 2012

MLS Schools

  • High School School District: Springfield District #186

Ownership History

Date Name Owned For Owner Type

Purchase Details

Listed on
May 31, 2013
Closed on
Jul 15, 2013
Seller's Agent
GRADY BROKER
GRADY REALTORS, INC.
Buyer's Agent
Malinda Ratliff
IN BETWEEN OFFICES
List Price
$93,500
Sold Price
$89,000
Premium/Discount to List
-$4,500
-4.81%
Current Estimated Value
$149,712

Home Financials for this Owner

Home Financials are based on the most recent Mortgage that was taken out on this home.
Estimated Appreciation
$60,712
Avg. Annual Appreciation
4.35%

Purchase Details

Closed on
Sep 4, 2012
Source: Public Records

Range of Values:

Collateral Analytics

Collateral Analytics Collateral Analytics AVMs (Automated Valuation Model) employ a number of statistical approaches combined with neighborhood-specific comparable selection guarantees the most up-to-date and precise valuations.

Not Available

Collateral Analytics does not have data for the current month. Please view the chart for historical values.

ICE

ICE Mortgage Technology ICE Mortgage Technology’s AVM (Automated Valuation Model) is a state-of-the-art online residential property valuation tool that provides a quick and accurate estimate of the value of almost any home in the U.S.

Not Available

ICE Mortgage Technology does not have data for the current month. Please view the chart for historical values.

First American

First American First American Data & Analytics’ next-generation AVM combines unrivaled data assets with a blended ensemble of valuation models to produce highly accurate, reliable valuations you can trust.

Not Available

First American does not have data for the current month. Please view the chart for historical values.

Quantarium

Quantarium Quantarium’s valuation service, repeatedly proven the industry’s most accurate and comprehensive, is supercharged with a self-learning and auto-tuning AI engine that continually becomes smarter and more accurate as it processes daily inputs from the industry’s leading RE data lake.

Not Available

Quantarium does not have data for the current month. Please view the chart for historical values.

Average Value
Not Available
List Price
Sold Price
Create a Home Valuation Report for This Property
The Home Valuation Report is an in-depth analysis detailing your home's value as well as a comparison with similar homes in the area

Home Values in the Area

Source: Public Records

Average Home Value in this Area


Source: Public Records

Purchase History

Date Buyer Sale Price Title Company
-- $89,000 --
-- -- --
Source: Public Records

Property History

Date Event Price Change Sq Ft Price
07/19/2013 07/19/13 Sold $89,000 -4.8% $74 / Sq Ft
06/04/2013 06/04/13 Pending -- -- --
05/31/2013 05/31/13 For Sale $93,500 -- $78 / Sq Ft
Source: RMLS Alliance

Tax History Compared to Growth

Source: Public Records

Tax History

Year Tax Paid Tax Assessment Tax Assessment Total Assessment is a certain percentage of the fair market value that is determined by local assessors to be the total taxable value of land and additions on the property. Land Improvement
2024 $2,828 $45,569 $8,882 $36,687
2023 $2,702 $42,193 $8,224 $33,969
2022 $2,541 $39,929 $7,783 $32,146
2021 $2,414 $38,364 $7,478 $30,886
2020 $3,266 $37,947 $7,397 $30,550
2019 $3,150 $37,284 $7,268 $30,016
2018 $3,043 $37,124 $7,237 $29,887
2017 $2,971 $36,554 $7,126 $29,428
2016 $2,881 $35,610 $6,942 $28,668
2015 $2,828 $34,806 $6,785 $28,021
2014 $2,780 $34,516 $6,728 $27,788
2013 $1,875 $34,886 $6,800 $28,086
Source: Public Records

Agents Affiliated with this Home

See All Agents

Map

Source: RMLS Alliance

MLS Number: RMACA132921

RMLS Alliance

APN: 22-08.0-204-013