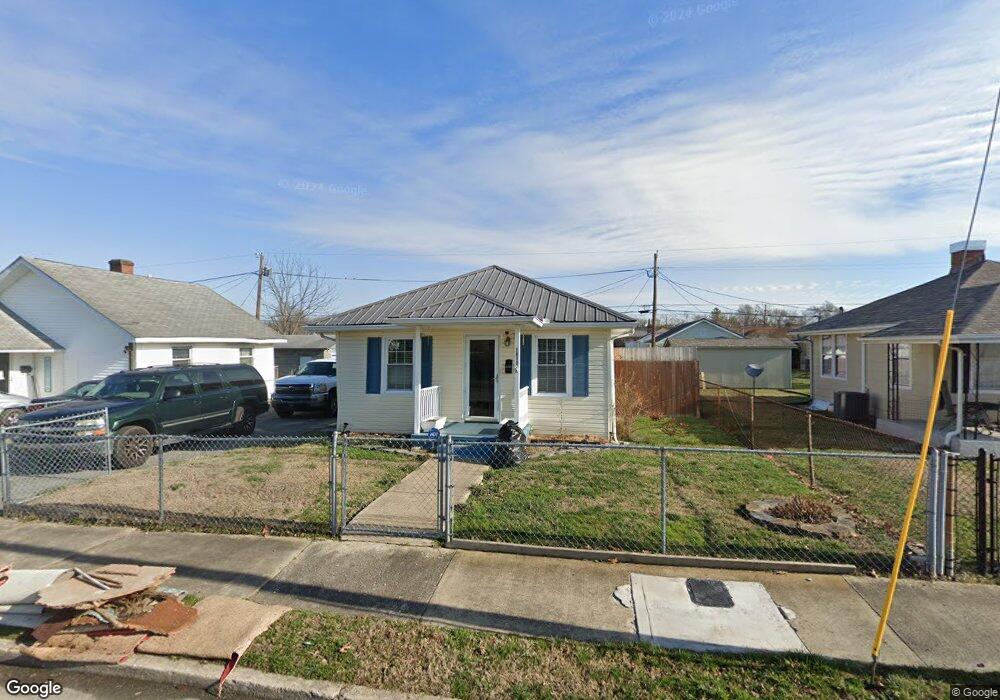
1310 Willow St Kingsport, TN 37664
Borden Village NeighborhoodEstimated Value: $118,383 - $158,000
2
Beds
1
Bath
880
Sq Ft
$157/Sq Ft
Est. Value
About This Home
This home is located at 1310 Willow St, Kingsport, TN 37664 and is currently estimated at $138,096, approximately $156 per square foot. 1310 Willow St is a home located in Sullivan County with nearby schools including Abraham Lincoln Elementary School, John Sevier Middle School, and Ross N. Robinson Middle School.
Ownership History
Date
Name
Owned For
Owner Type
Purchase Details
Closed on
Dec 9, 2014
Sold by
England Tammy
Bought by
Marshall Rita E
Current Estimated Value
Home Financials for this Owner
Home Financials are based on the most recent Mortgage that was taken out on this home.
Original Mortgage
$47,130
Outstanding Balance
$36,691
Interest Rate
4.37%
Mortgage Type
FHA
Estimated Equity
$101,405
Purchase Details
Closed on
May 16, 2012
Sold by
England Sandra Carol
Bought by
England Sandra Carol and England Tammy
Purchase Details
Closed on
Apr 5, 2006
Sold by
Leroy Morgan
Bought by
Carol England Sandra
Purchase Details
Closed on
Mar 12, 2004
Purchase Details
Closed on
May 3, 1999
Sold by
Andre Duffy Willie
Bought by
Dillard David P
Home Financials for this Owner
Home Financials are based on the most recent Mortgage that was taken out on this home.
Original Mortgage
$48,000
Interest Rate
7.88%
Create a Home Valuation Report for This Property
The Home Valuation Report is an in-depth analysis detailing your home's value as well as a comparison with similar homes in the area
Home Values in the Area
Average Home Value in this Area
Purchase History
| Date | Buyer | Sale Price | Title Company |
|---|---|---|---|
| Marshall Rita E | $48,000 | -- | |
| England Sandra Carol | -- | -- | |
| Carol England Sandra | -- | -- | |
| -- | $40,000 | -- | |
| Dillard David P | $48,000 | -- |
Source: Public Records
Mortgage History
| Date | Status | Borrower | Loan Amount |
|---|---|---|---|
| Open | Marshall Rita E | $47,130 | |
| Previous Owner | Dillard David P | $48,000 |
Source: Public Records
Tax History Compared to Growth
Tax History
| Year | Tax Paid | Tax Assessment Tax Assessment Total Assessment is a certain percentage of the fair market value that is determined by local assessors to be the total taxable value of land and additions on the property. | Land | Improvement |
|---|---|---|---|---|
| 2024 | -- | $14,550 | $2,550 | $12,000 |
| 2023 | $641 | $14,550 | $2,550 | $12,000 |
| 2022 | $641 | $14,550 | $2,550 | $12,000 |
| 2021 | $623 | $14,550 | $2,550 | $12,000 |
| 2020 | $373 | $14,550 | $2,550 | $12,000 |
| 2019 | $673 | $14,525 | $2,550 | $11,975 |
| 2018 | $657 | $14,525 | $2,550 | $11,975 |
| 2017 | $657 | $14,525 | $2,550 | $11,975 |
| 2016 | $540 | $11,625 | $1,400 | $10,225 |
| 2014 | $508 | $11,602 | $0 | $0 |
Source: Public Records
Map
Nearby Homes
- 1318 Willow St
- 1030 Federal St
- 1304 Holyoke St
- 1237 Holyoke St
- 1233 Holyoke St
- 1302 Chestnut St
- 1338 Holyoke St Unit 1338
- 1261 Chestnut St
- 1228 Garden Dr
- 809 Birch St
- 1420 Belmont Dr
- 1321 Pineola Ave
- 1312 Pineola Ave
- 1246 E Center St
- 1005 Yadkin St
- 1334 E Center St
- 1234 E Center St
- 1462 Valley Street Kingsport St
- 1462 Valley St
- 1005 Maple St
- 1314 Willow St
- 1306 Willow St
- 1309 E Sevier Ave
- 1313 E Sevier Ave
- 1305 E Sevier Ave
- 1001 Federal St
- 1005 Federal St
- 1309 Willow St
- 1317 E Sevier Ave
- 1305 Willow St
- 1009 Federal St
- 1322 Willow St
- 1313 Willow St
- 917 Federal St
- 1317 Willow St
- 1013 Federal St
- 1321 E Sevier Ave
- 1326 Willow St
- 1321 Willow St
- 909 Federal St