Estimated Value: $907,000 - $975,413
4
Beds
3
Baths
2,227
Sq Ft
$416/Sq Ft
Est. Value
About This Home
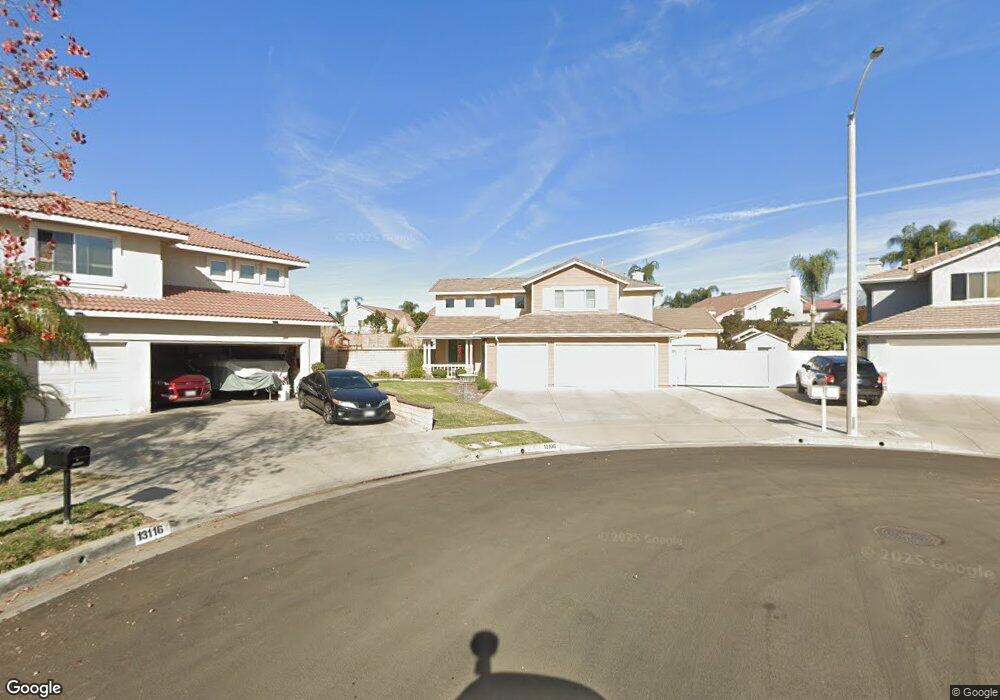
This home is located at 13106 Nighthawk Ct, Chino, CA 91710 and is currently estimated at $926,353, approximately $415 per square foot. 13106 Nighthawk Ct is a home located in San Bernardino County with nearby schools including Howard Cattle Elementary, Magnolia Junior High, and Chino High School.
Ownership History
Date
Name
Owned For
Owner Type
Purchase Details
Closed on
Jul 13, 2006
Sold by
Castaneda Amber Dawn
Bought by
Castaneda Amber D and The Amber D Castaneda Revocabl
Current Estimated Value
Purchase Details
Closed on
Apr 17, 2006
Sold by
Castaneda Amber Dawn
Bought by
Castaneda Amber Dawn
Home Financials for this Owner
Home Financials are based on the most recent Mortgage that was taken out on this home.
Original Mortgage
$200,000
Outstanding Balance
$114,867
Interest Rate
6.35%
Mortgage Type
Credit Line Revolving
Estimated Equity
$811,486
Purchase Details
Closed on
Aug 22, 2002
Sold by
Castaneda Eric W
Bought by
Castaneda Amber Dawn
Home Financials for this Owner
Home Financials are based on the most recent Mortgage that was taken out on this home.
Original Mortgage
$240,000
Interest Rate
6.43%
Purchase Details
Closed on
Mar 25, 1997
Sold by
Tava Development Co
Bought by
Castaneda Eric W and Castaneda Amber Dawn
Create a Home Valuation Report for This Property
The Home Valuation Report is an in-depth analysis detailing your home's value as well as a comparison with similar homes in the area
Home Values in the Area
Average Home Value in this Area
Purchase History
We collect this data history from publicly available records. To have your information removed, we recommend requesting removal directly through your county’s website.
| Date | Buyer | Sale Price | Title Company |
|---|---|---|---|
| Castaneda Amber D | -- | None Available | |
| Castaneda Amber Dawn | -- | Fidelity National Title | |
| Castaneda Amber Dawn | -- | Fidelity National Title Ins | |
| Castaneda Eric W | $200,000 | Chicago Title Co |
Source: Public Records
Mortgage History
We collect this data history from publicly available records. To have your information removed, we recommend requesting removal directly through your county’s website.
| Date | Status | Borrower | Loan Amount |
|---|---|---|---|
| Open | Castaneda Amber Dawn | $200,000 | |
| Closed | Castaneda Amber Dawn | $240,000 |
Source: Public Records
Tax History
| Year | Tax Paid | Tax Assessment Tax Assessment Total Assessment is a certain percentage of the fair market value that is determined by local assessors to be the total taxable value of land and additions on the property. | Land | Improvement |
|---|---|---|---|---|
| 2025 | $4,288 | $375,084 | $79,837 | $295,247 |
| 2024 | $4,178 | $367,730 | $78,272 | $289,458 |
| 2023 | $4,066 | $360,519 | $76,737 | $283,782 |
| 2022 | $4,041 | $353,450 | $75,232 | $278,218 |
| 2021 | $3,964 | $346,520 | $73,757 | $272,763 |
| 2020 | $3,915 | $342,967 | $73,001 | $269,966 |
| 2019 | $3,848 | $336,243 | $71,570 | $264,673 |
| 2018 | $3,766 | $329,650 | $70,167 | $259,483 |
| 2017 | $3,700 | $323,186 | $68,791 | $254,395 |
| 2016 | $3,468 | $316,849 | $67,442 | $249,407 |
| 2015 | $3,401 | $312,090 | $66,429 | $245,661 |
| 2014 | $3,336 | $305,977 | $65,128 | $240,849 |
Source: Public Records
Map
Nearby Homes
- 13035 Arlington Ln
- 6833 Renato Ct
- 13131 Melon Ave
- 6850 Meadowlark Ln
- 13150 Robin Ct
- 6963 Montego St
- 13055 Waterlily Way
- 12997 Falcon Place
- 6783 Bradford Ct
- 13227 Lamar Ave
- 6776 Bradford Ct
- 6755 Foxcroft Ct
- 2934 S Via Belamaria
- 14000 San Antonio Ave
- 2919 S Via Belamaria
- 13401 Hammer Ave
- 13431 Goldmedal Ave
- 13426 Corsican Ct
- 6751 Grant Ct
- 6351 Riverside Dr Unit 69
- 6751 Eagle Dr
- 6743 Eagle Dr
- 6759 Eagle Dr
- 6735 Eagle Dr
- 6767 Eagle Dr
- 13107 Pintail Ct
- 13050 Arlington Ln
- 6727 Eagle Dr
- 13067 Arlington Ln
- 13116 Nighthawk Ct
- 13117 Pintail Ct
- 13105 Nighthawk Ct
- 6736 Eagle Dr
- 13059 Arlington Ln
- 6719 Eagle Dr
- 13042 Arlington Ln
- 13108 Pintail Ct
- 6728 Eagle Dr
- 13051 Arlington Ln
- 13126 Nighthawk Ct
Your Personal Tour Guide
Ask me questions while you tour the home.