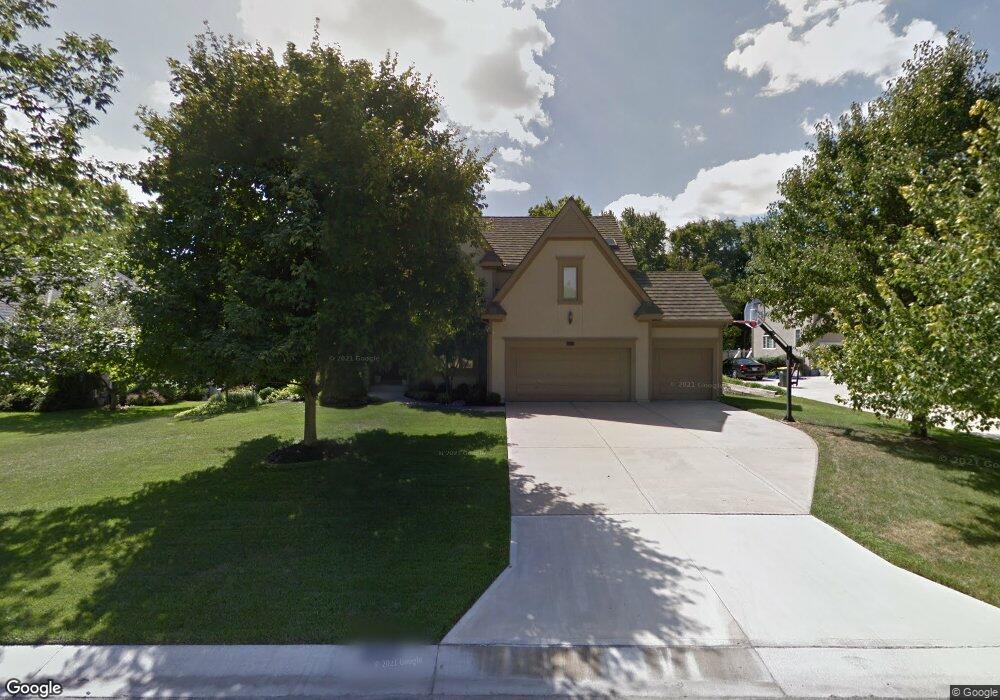
13108 Briar Dr Leawood, KS 66209
Estimated Value: $786,715 - $931,000
5
Beds
5
Baths
3,407
Sq Ft
$254/Sq Ft
Est. Value
About This Home
This home is located at 13108 Briar Dr, Leawood, KS 66209 and is currently estimated at $866,929, approximately $254 per square foot. 13108 Briar Dr is a home located in Johnson County with nearby schools including Overland Trail Elementary School, Overland Trail Middle School, and Blue Valley North High School.
Ownership History
Date
Name
Owned For
Owner Type
Purchase Details
Closed on
Jan 6, 2012
Sold by
Loftspring Peter D and Loftspring Sharon J
Bought by
Loftspring Peter David and Loftspring Sharon Jaffee
Current Estimated Value
Home Financials for this Owner
Home Financials are based on the most recent Mortgage that was taken out on this home.
Original Mortgage
$333,500
Outstanding Balance
$36,919
Interest Rate
3.37%
Mortgage Type
New Conventional
Estimated Equity
$830,010
Purchase Details
Closed on
Oct 5, 2011
Sold by
Loftspring Peter D and Lotfspring Sharon J
Bought by
Loftspring Peter David and Loftspring Sharon Jaffee
Purchase Details
Closed on
Aug 2, 2006
Sold by
Anderson Mark A and Anderson Teresa K
Bought by
Loftspring Peter D and Loftspring Sharon J
Home Financials for this Owner
Home Financials are based on the most recent Mortgage that was taken out on this home.
Original Mortgage
$400,800
Interest Rate
6.33%
Mortgage Type
New Conventional
Create a Home Valuation Report for This Property
The Home Valuation Report is an in-depth analysis detailing your home's value as well as a comparison with similar homes in the area
Home Values in the Area
Average Home Value in this Area
Purchase History
| Date | Buyer | Sale Price | Title Company |
|---|---|---|---|
| Loftspring Peter David | -- | Affinity Title Company | |
| Loftspring Peter D | -- | Affinity Title Company | |
| Loftspring Peter David | -- | None Available | |
| Loftspring Peter D | -- | Chicago Title Insurance Co |
Source: Public Records
Mortgage History
| Date | Status | Borrower | Loan Amount |
|---|---|---|---|
| Open | Loftspring Peter D | $333,500 | |
| Closed | Loftspring Peter D | $400,800 |
Source: Public Records
Tax History Compared to Growth
Tax History
| Year | Tax Paid | Tax Assessment Tax Assessment Total Assessment is a certain percentage of the fair market value that is determined by local assessors to be the total taxable value of land and additions on the property. | Land | Improvement |
|---|---|---|---|---|
| 2024 | $10,389 | $92,874 | $19,642 | $73,232 |
| 2023 | $9,856 | $87,147 | $19,642 | $67,505 |
| 2022 | $9,235 | $79,948 | $19,642 | $60,306 |
| 2021 | $8,682 | $71,875 | $19,642 | $52,233 |
| 2020 | $8,606 | $69,805 | $19,642 | $50,163 |
| 2019 | $8,379 | $66,758 | $17,860 | $48,898 |
| 2018 | $8,274 | $64,746 | $17,860 | $46,886 |
| 2017 | $8,310 | $63,940 | $14,886 | $49,054 |
| 2016 | $7,695 | $59,294 | $13,102 | $46,192 |
| 2015 | $7,711 | $58,696 | $13,102 | $45,594 |
| 2013 | -- | $55,994 | $13,102 | $42,892 |
Source: Public Records
Map
Nearby Homes
- 4989 W 131st Place
- 13143 Rosewood St
- 4908 W 131st Terrace
- 4801 W 133rd St Unit 301
- 13216 Granada Dr
- 4951 W 134th St Unit 101
- 4951 W 134th St Unit 401
- 3349 W 133rd Terrace
- 3345 W 133rd Terrace
- 3357 W 133rd Terrace
- 13008 Fontana St
- 13009 Fontana St
- 5617 W 131st St
- 3456 W 133rd Terrace
- 3260 W 133rd Terrace
- 3344 W 133rd Terrace
- 2760 W 133rd Terrace
- 2756 W 133rd Terrace
- 2840 W 133rd Terrace
- 2844 W 133rd Terrace
- 13104 Briar Dr
- 13112 Briar Dr
- 13163 Rosewood Dr
- 13159 Rosewood Dr
- 13167 Rosewood Dr
- 13167 Rosewood St
- 13155 Rosewood Dr
- 13113 Briar Dr
- 13109 Briar St
- 13109 Briar Dr
- 13100 Briar Dr
- 13151 Rosewood St
- 13151 Rosewood Dr
- 13117 Briar Dr
- 13200 Briar Dr
- 13105 Briar Dr
- 13101 Briar Dr
- 13147 Rosewood St
- 5201 W 132nd Terrace
- 13147 Rosewood Dr