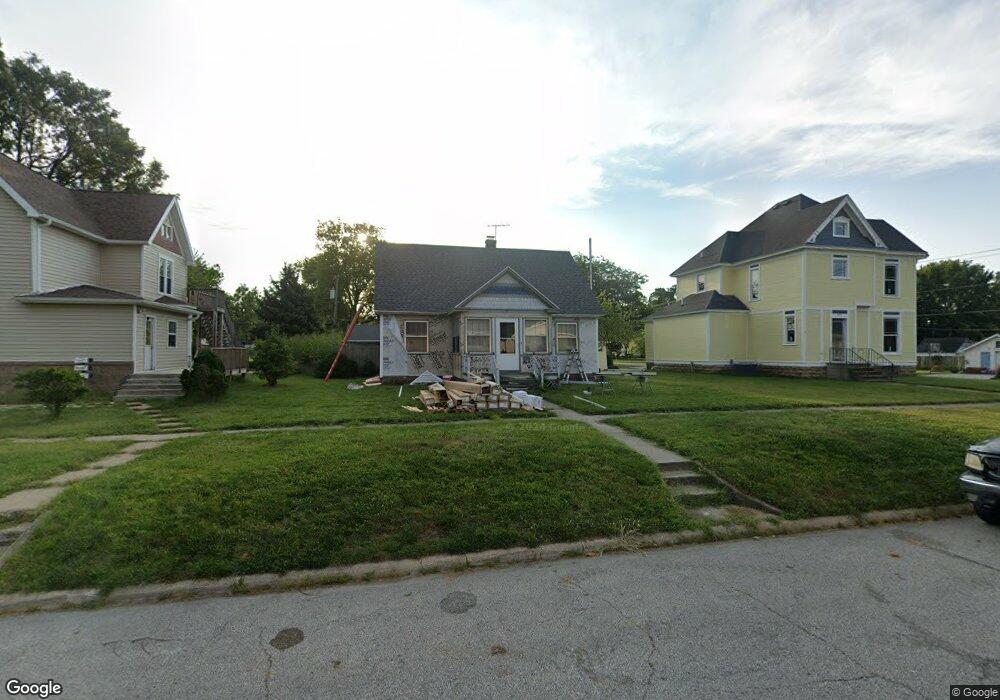
1311 7th St Nevada, IA 50201
Estimated Value: $211,000 - $241,403
3
Beds
2
Baths
1,389
Sq Ft
$163/Sq Ft
Est. Value
About This Home
This home is located at 1311 7th St, Nevada, IA 50201 and is currently estimated at $226,101, approximately $162 per square foot. 1311 7th St is a home located in Story County with nearby schools including Central Elementary School, Nevada Middle School, and Nevada High School.
Ownership History
Date
Name
Owned For
Owner Type
Purchase Details
Closed on
Jun 30, 2009
Sold by
Us National Bank
Bought by
Engelman Daniel Frederick and Engelman Kelly Renee
Current Estimated Value
Home Financials for this Owner
Home Financials are based on the most recent Mortgage that was taken out on this home.
Original Mortgage
$51,000
Outstanding Balance
$33,352
Interest Rate
5.43%
Mortgage Type
New Conventional
Estimated Equity
$192,749
Purchase Details
Closed on
Apr 28, 2009
Sold by
Kellar Michael and Kellar Michael
Bought by
Us Bank National Assn and Bank Of America Na
Create a Home Valuation Report for This Property
The Home Valuation Report is an in-depth analysis detailing your home's value as well as a comparison with similar homes in the area
Home Values in the Area
Average Home Value in this Area
Purchase History
| Date | Buyer | Sale Price | Title Company |
|---|---|---|---|
| Engelman Daniel Frederick | $101,500 | -- | |
| Us Bank National Assn | $103,661 | -- |
Source: Public Records
Mortgage History
| Date | Status | Borrower | Loan Amount |
|---|---|---|---|
| Open | Engelman Daniel Frederick | $51,000 |
Source: Public Records
Tax History Compared to Growth
Tax History
| Year | Tax Paid | Tax Assessment Tax Assessment Total Assessment is a certain percentage of the fair market value that is determined by local assessors to be the total taxable value of land and additions on the property. | Land | Improvement |
|---|---|---|---|---|
| 2025 | $3,314 | $226,300 | $45,000 | $181,300 |
| 2024 | $3,230 | $210,000 | $39,000 | $171,000 |
| 2023 | $3,186 | $210,000 | $39,000 | $171,000 |
| 2022 | $3,154 | $170,800 | $36,000 | $134,800 |
| 2021 | $3,066 | $170,800 | $36,000 | $134,800 |
| 2020 | $2,974 | $157,000 | $33,000 | $124,000 |
| 2019 | $2,974 | $157,000 | $33,000 | $124,000 |
| 2018 | $2,958 | $146,400 | $33,000 | $113,400 |
| 2017 | $2,958 | $146,400 | $33,000 | $113,400 |
| 2016 | $2,726 | $136,100 | $24,000 | $112,100 |
| 2015 | $2,726 | $136,100 | $24,000 | $112,100 |
| 2014 | $2,600 | $128,400 | $24,000 | $104,400 |
Source: Public Records
Map
Nearby Homes