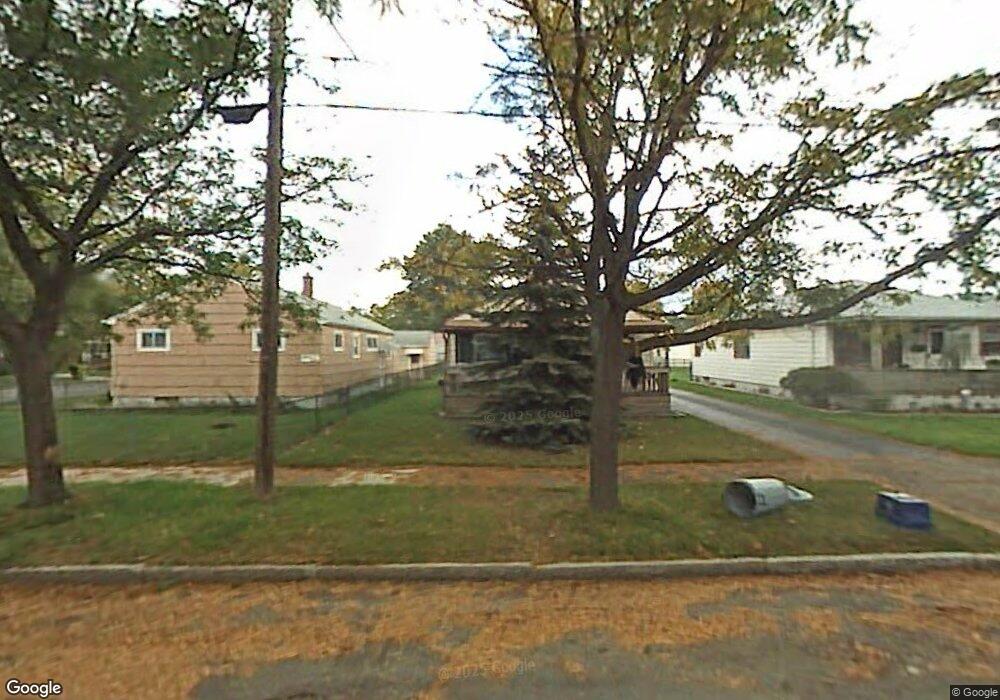
1311 92nd St Niagara Falls, NY 14304
LaSalle NeighborhoodEstimated Value: $187,000 - $213,000
3
Beds
1
Bath
984
Sq Ft
$199/Sq Ft
Est. Value
About This Home
This home is located at 1311 92nd St, Niagara Falls, NY 14304 and is currently estimated at $195,400, approximately $198 per square foot. 1311 92nd St is a home located in Niagara County with nearby schools including Niagara Falls High School, Christ the King Preparatory Academy, and Catholic Academy Of Niagara Falls - Elementary.
Ownership History
Date
Name
Owned For
Owner Type
Purchase Details
Closed on
May 29, 2010
Sold by
Ball John W and Ball Donna J
Bought by
Ball Jennifer
Current Estimated Value
Home Financials for this Owner
Home Financials are based on the most recent Mortgage that was taken out on this home.
Original Mortgage
$3,000
Outstanding Balance
$2,025
Interest Rate
5.12%
Mortgage Type
Unknown
Estimated Equity
$193,375
Create a Home Valuation Report for This Property
The Home Valuation Report is an in-depth analysis detailing your home's value as well as a comparison with similar homes in the area
Home Values in the Area
Average Home Value in this Area
Purchase History
| Date | Buyer | Sale Price | Title Company |
|---|---|---|---|
| Ball Jennifer | $59,000 | Fidelity Natl Title Ins Co |
Source: Public Records
Mortgage History
| Date | Status | Borrower | Loan Amount |
|---|---|---|---|
| Open | Ball Jennifer | $3,000 | |
| Open | Ball Jennifer | $57,230 |
Source: Public Records
Tax History Compared to Growth
Tax History
| Year | Tax Paid | Tax Assessment Tax Assessment Total Assessment is a certain percentage of the fair market value that is determined by local assessors to be the total taxable value of land and additions on the property. | Land | Improvement |
|---|---|---|---|---|
| 2024 | $3,741 | $69,800 | $4,300 | $65,500 |
| 2023 | $1,988 | $69,800 | $4,300 | $65,500 |
| 2022 | $1,648 | $69,800 | $4,300 | $65,500 |
| 2021 | $1,624 | $69,800 | $4,300 | $65,500 |
| 2020 | $1,140 | $69,800 | $4,300 | $65,500 |
| 2019 | $1,300 | $69,800 | $4,300 | $65,500 |
| 2018 | $1,533 | $69,800 | $4,300 | $65,500 |
| 2017 | $1,300 | $69,800 | $4,300 | $65,500 |
| 2016 | $1,829 | $69,800 | $4,300 | $65,500 |
| 2015 | -- | $69,800 | $4,300 | $65,500 |
| 2014 | -- | $69,800 | $4,300 | $65,500 |
Source: Public Records
Map
Nearby Homes