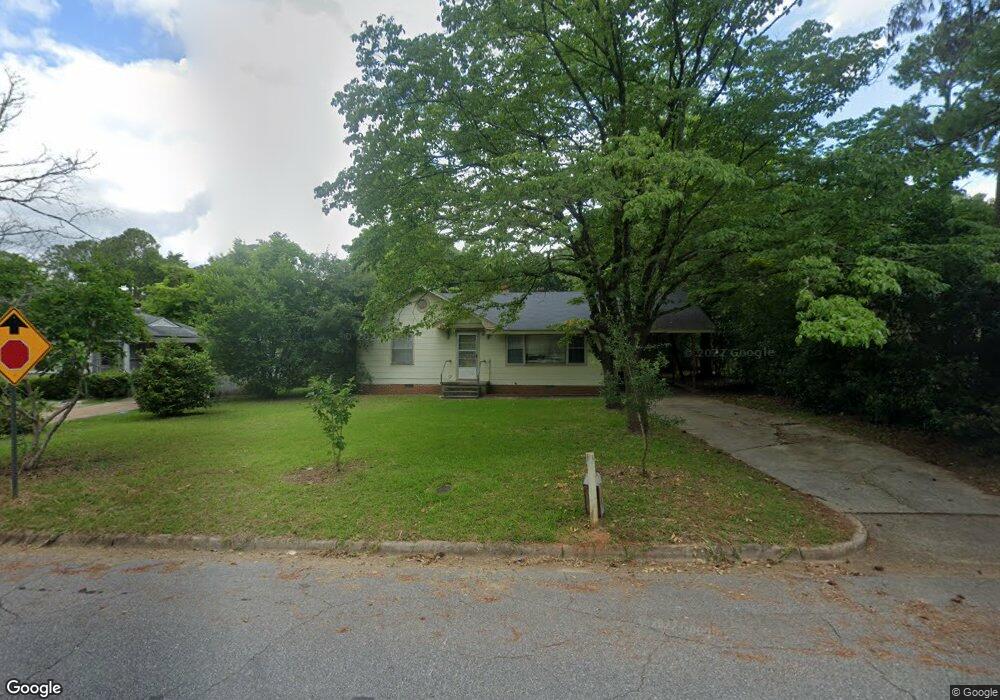
1311 9th Ave Albany, GA 31707
Palmyra Heights NeighborhoodEstimated Value: $85,000 - $106,000
2
Beds
1
Bath
1,468
Sq Ft
$64/Sq Ft
Est. Value
About This Home
This home is located at 1311 9th Ave, Albany, GA 31707 and is currently estimated at $93,287, approximately $63 per square foot. 1311 9th Ave is a home located in Dougherty County with nearby schools including Sherwood Acres Elementary School, Merry Acres Middle School, and Westover High School.
Ownership History
Date
Name
Owned For
Owner Type
Purchase Details
Closed on
May 23, 2023
Sold by
Landis Commella C
Bought by
Denson Jordan L
Current Estimated Value
Home Financials for this Owner
Home Financials are based on the most recent Mortgage that was taken out on this home.
Original Mortgage
$53,350
Outstanding Balance
$46,649
Interest Rate
5.71%
Mortgage Type
New Conventional
Estimated Equity
$46,638
Purchase Details
Closed on
Mar 22, 2012
Sold by
Ennis Myra N
Bought by
Nichols Elizabeth E
Purchase Details
Closed on
Jun 19, 1997
Sold by
Nichols Estate Of Cleveland Olan By Exec
Bought by
Nichols Doris W
Purchase Details
Closed on
Feb 26, 1970
Sold by
Nichols Elizabeth
Bought by
Nichols C O
Create a Home Valuation Report for This Property
The Home Valuation Report is an in-depth analysis detailing your home's value as well as a comparison with similar homes in the area
Home Values in the Area
Average Home Value in this Area
Purchase History
| Date | Buyer | Sale Price | Title Company |
|---|---|---|---|
| Denson Jordan L | $55,000 | -- | |
| Nichols Elizabeth E | $31,250 | -- | |
| Nichols Doris W | -- | -- | |
| Nichols C O | -- | -- |
Source: Public Records
Mortgage History
| Date | Status | Borrower | Loan Amount |
|---|---|---|---|
| Open | Denson Jordan L | $53,350 |
Source: Public Records
Tax History
| Year | Tax Paid | Tax Assessment Tax Assessment Total Assessment is a certain percentage of the fair market value that is determined by local assessors to be the total taxable value of land and additions on the property. | Land | Improvement |
|---|---|---|---|---|
| 2025 | $1,264 | $24,960 | $6,080 | $18,880 |
| 2024 | $1,264 | $24,960 | $6,080 | $18,880 |
| 2023 | $1,092 | $23,440 | $6,080 | $17,360 |
| 2022 | $1,096 | $23,440 | $6,080 | $17,360 |
| 2021 | $1,016 | $23,440 | $6,080 | $17,360 |
| 2020 | $1,019 | $23,440 | $6,080 | $17,360 |
| 2019 | $1,022 | $23,440 | $6,080 | $17,360 |
| 2018 | $1,027 | $23,440 | $6,080 | $17,360 |
| 2017 | $957 | $23,440 | $6,080 | $17,360 |
| 2016 | $957 | $23,440 | $6,080 | $17,360 |
| 2015 | $960 | $23,440 | $6,080 | $17,360 |
| 2014 | $1,011 | $25,000 | $7,640 | $17,360 |
Source: Public Records
Map
Nearby Homes
Your Personal Tour Guide
Ask me questions while you tour the home.