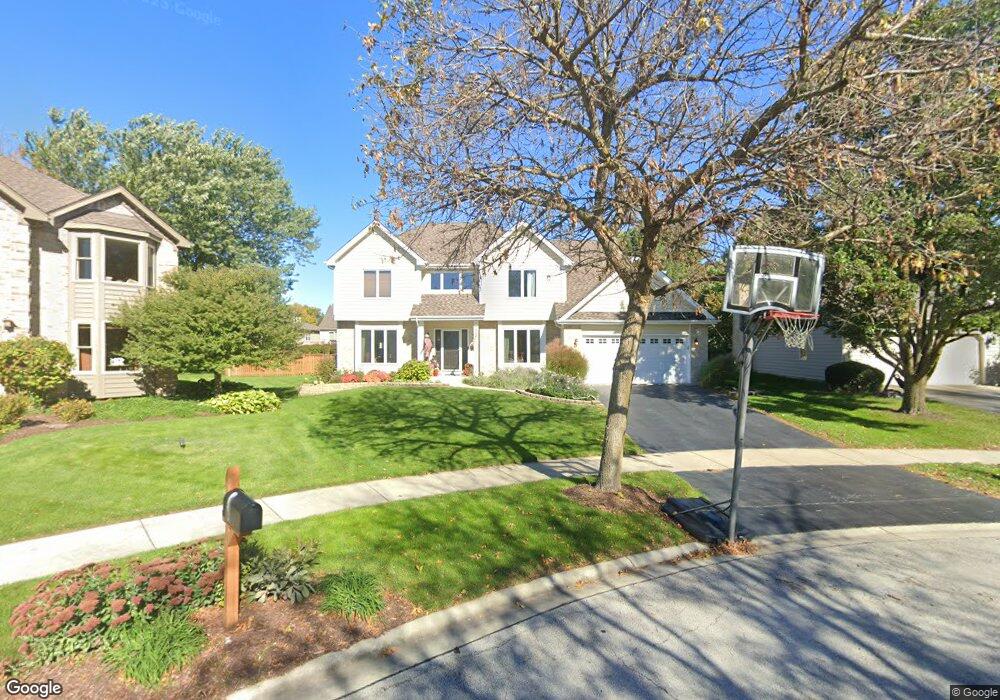
1311 Avon Ct Unit 3 Naperville, IL 60564
Ashbury NeighborhoodEstimated Value: $671,720 - $756,000
Studio
1
Bath
2,773
Sq Ft
$262/Sq Ft
Est. Value
About This Home
This home is located at 1311 Avon Ct Unit 3, Naperville, IL 60564 and is currently estimated at $727,680, approximately $262 per square foot. 1311 Avon Ct Unit 3 is a home located in Will County with nearby schools including Patterson Elementary School, Gordon Gregory Middle School, and Neuqua Valley High School.
Ownership History
Date
Name
Owned For
Owner Type
Purchase Details
Closed on
Mar 19, 2021
Sold by
Farmer Robert M
Bought by
Robert M Farmer Trust and Farmer
Current Estimated Value
Purchase Details
Closed on
Jun 4, 2002
Sold by
Burel Mark T and Burel Cynthia C
Bought by
Farmer Robert M and Farmer Mary L
Home Financials for this Owner
Home Financials are based on the most recent Mortgage that was taken out on this home.
Original Mortgage
$300,700
Interest Rate
6.12%
Purchase Details
Closed on
Sep 12, 1995
Sold by
Horning Robert J and Horning Cheryl M
Bought by
Burel Mark T and Burel Cynthia C
Home Financials for this Owner
Home Financials are based on the most recent Mortgage that was taken out on this home.
Original Mortgage
$209,600
Interest Rate
7.25%
Purchase Details
Closed on
Feb 27, 1995
Sold by
Horning Robert J
Bought by
Horning Robert J and Horning Cheryl M
Create a Home Valuation Report for This Property
The Home Valuation Report is an in-depth analysis detailing your home's value as well as a comparison with similar homes in the area
Home Values in the Area
Average Home Value in this Area
Purchase History
| Date | Buyer | Sale Price | Title Company |
|---|---|---|---|
| Robert M Farmer Trust | -- | Kuhn Mckenzie | |
| Farmer Robert M | $358,000 | Wheatland Title | |
| Burel Mark T | $262,000 | Law Title | |
| Horning Robert J | -- | -- |
Source: Public Records
Mortgage History
| Date | Status | Borrower | Loan Amount |
|---|---|---|---|
| Previous Owner | Farmer Robert M | $300,700 | |
| Previous Owner | Burel Mark T | $209,600 |
Source: Public Records
Tax History
| Year | Tax Paid | Tax Assessment Tax Assessment Total Assessment is a certain percentage of the fair market value that is determined by local assessors to be the total taxable value of land and additions on the property. | Land | Improvement |
|---|---|---|---|---|
| 2024 | $12,868 | $204,467 | $65,131 | $139,336 |
| 2023 | $12,868 | $180,624 | $57,536 | $123,088 |
| 2022 | $11,890 | $170,105 | $54,428 | $115,677 |
| 2021 | $11,052 | $162,005 | $51,836 | $110,169 |
| 2020 | $10,837 | $159,438 | $51,015 | $108,423 |
| 2019 | $10,641 | $154,944 | $49,577 | $105,367 |
| 2018 | $10,663 | $152,622 | $48,487 | $104,135 |
| 2017 | $10,476 | $144,211 | $47,235 | $96,976 |
| 2016 | $10,456 | $141,106 | $46,218 | $94,888 |
| 2015 | $10,452 | $135,678 | $44,440 | $91,238 |
| 2014 | $10,452 | $133,060 | $44,440 | $88,620 |
| 2013 | $10,452 | $133,060 | $44,440 | $88,620 |
Source: Public Records
Map
Nearby Homes
- 3740 Caine Dr
- 1244 Hollingswood Ave
- 3412 Falkner Dr
- 3819 Capri Ct
- 1367 Saxon Ln
- 1364 Saxon Ln
- 3718 Tramore Ct
- 3804 Relstar Ct
- 1007 Hollingswood Ct
- 4204 Falkner Dr Unit 3
- 3027 Brossman St
- 3111 Landore Dr
- 3339 Timber Creek Ln Unit 3
- 719 Eagle Brook Ln Unit 4
- 2255 Wendt Cir
- 230 Willow Bend
- 2627 Homestead Dr
- 29W376 Wagner Rd
- 4507 Barr Creek Ln
- 2715 Wendy Dr
- 1315 Avon Ct Unit 3
- 1307 Avon Ct
- 1312 Hamlet Rd Unit 3
- 1316 Hamlet Rd
- 1308 Hamlet Rd
- 1320 Hamlet Rd
- 1303 Avon Ct
- 1316 Avon Ct
- 3612 Falkner Dr Unit 3
- 3616 Falkner Dr
- 1304 Hamlet Rd
- 3620 Falkner Dr Unit 3
- 3608 Falkner Dr
- 1312 Avon Ct
- 1308 Avon Ct
- 1304 Avon Ct
- 3624 Falkner Dr
- 1315 Hamlet Rd
- 1319 Hamlet Rd
- 3628 Falkner Dr
Your Personal Tour Guide
Ask me questions while you tour the home.