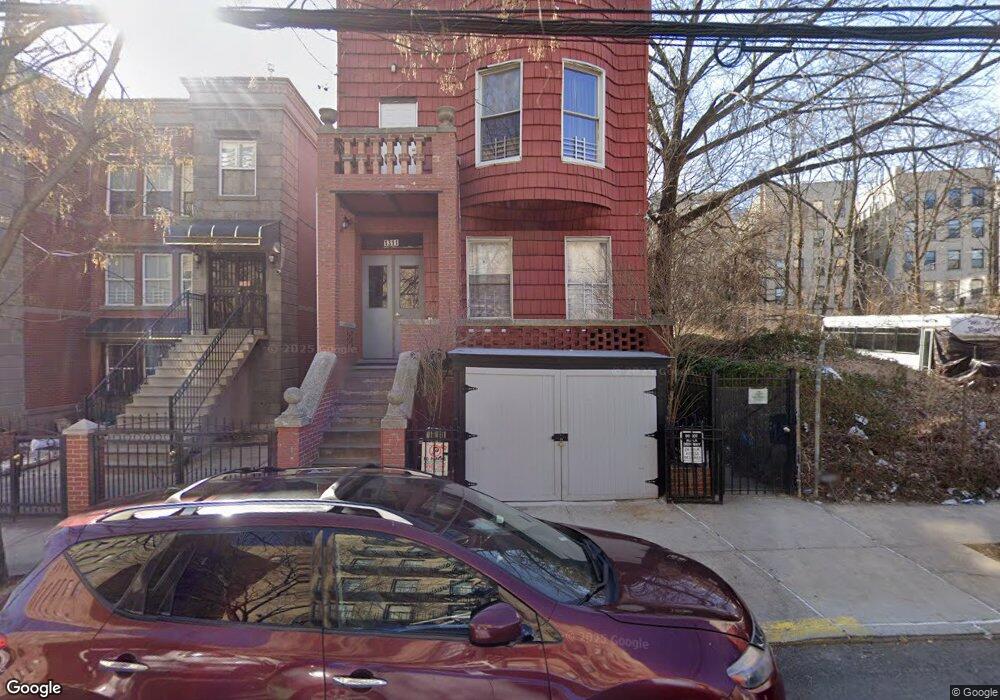
1311 Chisholm St Bronx, NY 10459
Crotona Park East NeighborhoodEstimated Value: $692,285 - $898,000
--
Bed
--
Bath
2,391
Sq Ft
$326/Sq Ft
Est. Value
About This Home
This home is located at 1311 Chisholm St, Bronx, NY 10459 and is currently estimated at $778,821, approximately $325 per square foot. 1311 Chisholm St is a home located in Bronx County with nearby schools including P.S. 134 - George F. Bristow, P.S. 214, and Mott Hall Charter School.
Ownership History
Date
Name
Owned For
Owner Type
Purchase Details
Closed on
Oct 14, 2021
Sold by
Js Realty Investor Llc
Bought by
Freeman Partners Realty Llc
Current Estimated Value
Home Financials for this Owner
Home Financials are based on the most recent Mortgage that was taken out on this home.
Original Mortgage
$600,000
Outstanding Balance
$547,778
Interest Rate
2.88%
Mortgage Type
Purchase Money Mortgage
Estimated Equity
$231,043
Purchase Details
Closed on
Nov 8, 2017
Sold by
Miles As Referee Charmaine L
Bought by
Js Realty Investor Llc
Home Financials for this Owner
Home Financials are based on the most recent Mortgage that was taken out on this home.
Original Mortgage
$294,000
Interest Rate
3.9%
Mortgage Type
Purchase Money Mortgage
Purchase Details
Closed on
Feb 1, 2017
Sold by
Figueroa Jose M
Bought by
Nyc Reo Llc
Purchase Details
Closed on
Nov 29, 1996
Sold by
Melendez Maria
Bought by
Figueroa Jose M
Create a Home Valuation Report for This Property
The Home Valuation Report is an in-depth analysis detailing your home's value as well as a comparison with similar homes in the area
Home Values in the Area
Average Home Value in this Area
Purchase History
| Date | Buyer | Sale Price | Title Company |
|---|---|---|---|
| Freeman Partners Realty Llc | -- | -- | |
| Js Realty Investor Llc | $397,488 | -- | |
| Nyc Reo Llc | $454,951 | -- | |
| Figueroa Jose M | -- | -- |
Source: Public Records
Mortgage History
| Date | Status | Borrower | Loan Amount |
|---|---|---|---|
| Open | Freeman Partners Realty Llc | $600,000 | |
| Previous Owner | Js Realty Investor Llc | $294,000 |
Source: Public Records
Tax History Compared to Growth
Tax History
| Year | Tax Paid | Tax Assessment Tax Assessment Total Assessment is a certain percentage of the fair market value that is determined by local assessors to be the total taxable value of land and additions on the property. | Land | Improvement |
|---|---|---|---|---|
| 2025 | $5,891 | $30,156 | $7,823 | $22,333 |
| 2024 | $5,891 | $29,332 | $6,894 | $22,438 |
| 2023 | $5,800 | $28,558 | $7,175 | $21,383 |
| 2022 | $5,570 | $48,240 | $12,000 | $36,240 |
| 2021 | $2,584 | $34,500 | $12,000 | $22,500 |
| 2020 | $2,564 | $33,420 | $12,000 | $21,420 |
| 2019 | $2,390 | $30,240 | $12,000 | $18,240 |
| 2018 | $2,198 | $10,782 | $4,474 | $6,308 |
| 2017 | $2,086 | $10,233 | $6,002 | $4,231 |
| 2016 | $2,046 | $10,233 | $6,336 | $3,897 |
| 2015 | $1,164 | $10,094 | $4,436 | $5,658 |
| 2014 | $1,164 | $9,523 | $3,698 | $5,825 |
Source: Public Records
Map
Nearby Homes
- 1321 Bristow St
- 1333 Bristow St
- 1347 Bristow St Unit 4B
- 1371 Prospect Ave
- 1352 Prospect Ave
- 1380 Bristow St
- 831 Jennings St
- 805 E 170th St
- 807 E 170th St
- 1241 Intervale Ave
- 1192 Fox St
- 1405 Louis Niñé Blvd
- 757 E 169th St Unit 2A
- 665 Jefferson Place
- 865 Home St
- 1386 Clinton Ave
- 1384 Clinton Ave
- 1266 Boston Rd
- 852 Home St Unit 2F
- 1140 Fox St
- 1315 Chisholm St
- 1309 Chisholm St
- 1307 Chisholm St
- 847 Freeman St
- 843 Freeman St
- 1305 Chisholm St
- 1303 Chisholm St
- 841 Freeman St
- 1321 Chisholm St
- 839 Freeman St
- 1323 Chisholm St
- 1323 Chisholm St Unit 6 D
- 1323 Chisholm St Unit 3 C
- 1323 Chisholm St Unit 7-C
- 1323 Chisholm St Unit 5-B
- 1323 Chisholm St Unit 4-D
- 1323 Chisholm St Unit 7-A
- 1323 Chisholm St Unit 2-C
- 1323 Chisholm St Unit 3-B
- 1323 Chisholm St Unit 3-D