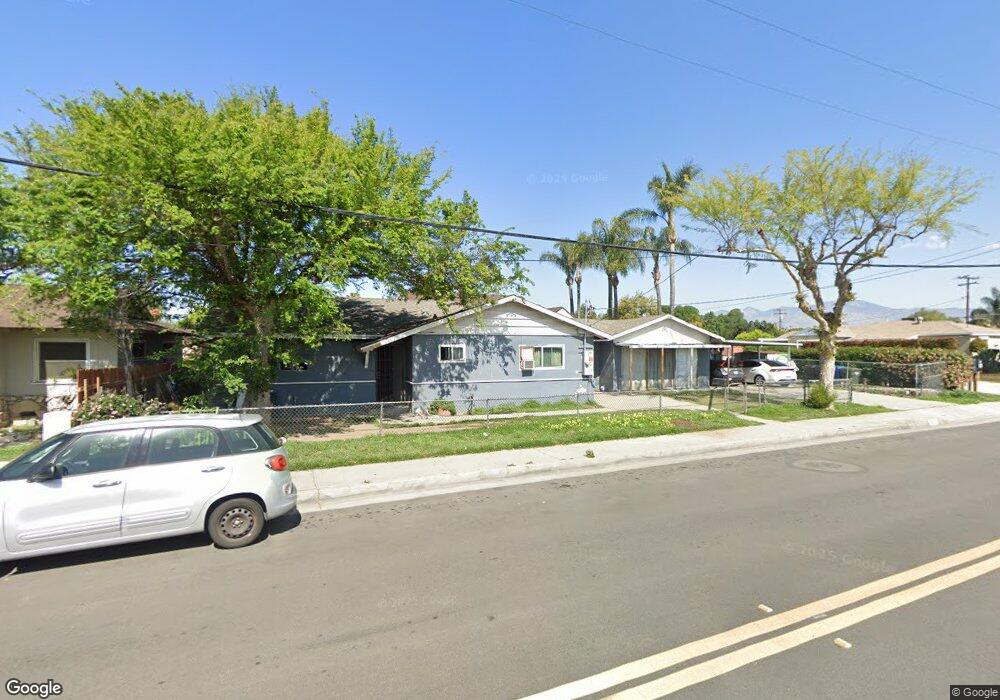
1311 Durfee Ave South El Monte, CA 91733
Estimated Value: $757,916 - $953,000
4
Beds
2
Baths
1,844
Sq Ft
$469/Sq Ft
Est. Value
About This Home
This home is located at 1311 Durfee Ave, South El Monte, CA 91733 and is currently estimated at $865,729, approximately $469 per square foot. 1311 Durfee Ave is a home located in Los Angeles County with nearby schools including New Temple Elementary School, Dean L. Shively Middle School, and South El Monte High School.
Ownership History
Date
Name
Owned For
Owner Type
Purchase Details
Closed on
Dec 19, 2000
Sold by
Morales Angelina
Bought by
Morales Guilebaldo
Current Estimated Value
Home Financials for this Owner
Home Financials are based on the most recent Mortgage that was taken out on this home.
Original Mortgage
$193,405
Outstanding Balance
$70,910
Interest Rate
7.81%
Mortgage Type
FHA
Estimated Equity
$794,819
Purchase Details
Closed on
Nov 16, 2000
Sold by
Lopez Sylvia M and Contreras Linda G
Bought by
Morales Guilebaldo
Home Financials for this Owner
Home Financials are based on the most recent Mortgage that was taken out on this home.
Original Mortgage
$193,405
Outstanding Balance
$70,910
Interest Rate
7.81%
Mortgage Type
FHA
Estimated Equity
$794,819
Purchase Details
Closed on
Sep 15, 1994
Sold by
Flores Rudolph A
Bought by
Flores Rudolph A and Rudolph A Flores Family Trust
Create a Home Valuation Report for This Property
The Home Valuation Report is an in-depth analysis detailing your home's value as well as a comparison with similar homes in the area
Home Values in the Area
Average Home Value in this Area
Purchase History
| Date | Buyer | Sale Price | Title Company |
|---|---|---|---|
| Morales Guilebaldo | -- | Old Republic Title Company | |
| Morales Guilebaldo | $195,000 | Old Republic Title Company | |
| Flores Rudolph A | -- | -- |
Source: Public Records
Mortgage History
| Date | Status | Borrower | Loan Amount |
|---|---|---|---|
| Open | Morales Guilebaldo | $193,405 | |
| Closed | Morales Guilebaldo | $5,850 |
Source: Public Records
Tax History Compared to Growth
Tax History
| Year | Tax Paid | Tax Assessment Tax Assessment Total Assessment is a certain percentage of the fair market value that is determined by local assessors to be the total taxable value of land and additions on the property. | Land | Improvement |
|---|---|---|---|---|
| 2025 | $3,677 | $293,809 | $176,286 | $117,523 |
| 2024 | $3,677 | $288,049 | $172,830 | $115,219 |
| 2023 | $3,579 | $282,402 | $169,442 | $112,960 |
| 2022 | $3,520 | $276,866 | $166,120 | $110,746 |
| 2021 | $3,466 | $271,438 | $162,863 | $108,575 |
| 2019 | $3,480 | $263,389 | $158,034 | $105,355 |
| 2018 | $3,292 | $258,226 | $154,936 | $103,290 |
| 2016 | $3,138 | $248,201 | $148,921 | $99,280 |
| 2015 | $3,105 | $244,474 | $146,685 | $97,789 |
| 2014 | $3,043 | $239,686 | $143,812 | $95,874 |
Source: Public Records
Map
Nearby Homes
- 11264 Linard St
- 1312 Penn Mar Ave
- 1528 Durfee Ave
- 1227 Esteban Torres Dr
- 10907 Danielson Dr
- 10839 Skyline Dr
- 11073 Andrews St
- 11244 Broadmead St
- 11249 Broadmead St
- 1318 Merced Ave
- 2247 Kaydel Rd
- 11408 Herb St Unit 2
- 11436 Herb St
- 2258 Kaydel Rd
- 4003 Valley Oak Ln Unit B
- 4003 Valley Oak Ln Unit C
- 4003 Valley Oak Ln Unit D
- 4001 Valley Oak Ln Unit D
- 4001 Valley Oak Ln Unit C
- 4003 Valley Oak Ln Unit E
- 1315 Durfee Ave
- 1303 Durfee Ave
- 1325 Durfee Ave
- 11229 Maplefield St
- 1300 Durfee Ave
- 1320 Durfee Ave
- 1329 Durfee Ave
- 1319 Durfee Ave
- 1317 Durfee Ave
- 11258 Byways St
- 11259 Byways St
- 11223 Maplefield St
- 1333 Durfee Ave
- 11232 Central Ave
- 11226 Central Ave
- 11262 Byways St
- 11267 Byways St
- 11224 Maplefield St
- 1606 Durfee Ave
- 11222 Central Ave