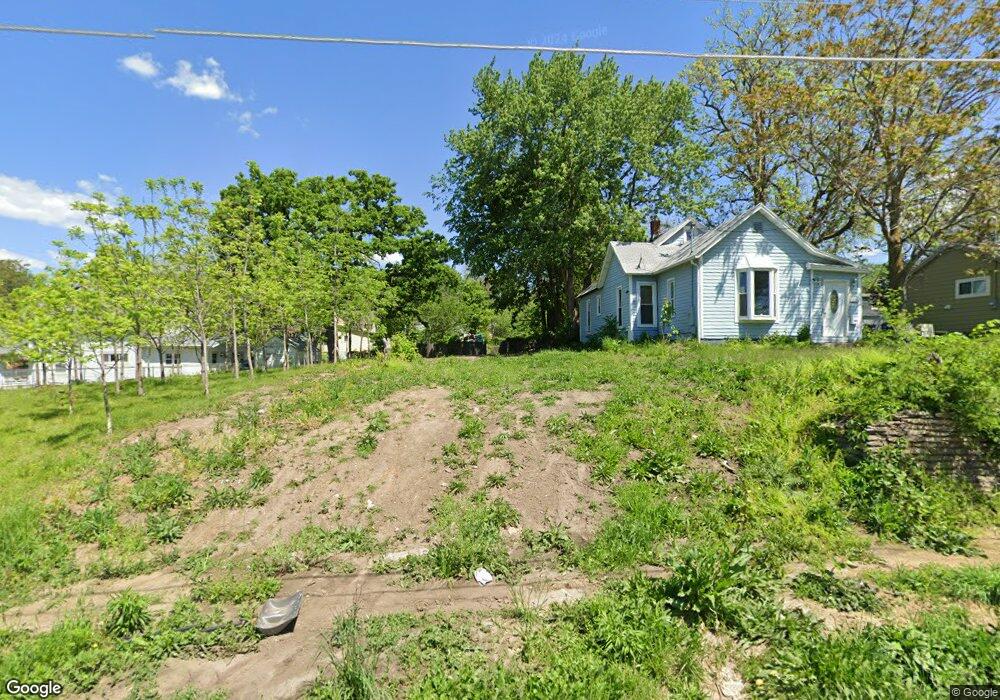
1311 Laurel St Des Moines, IA 50314
Cheatom Park NeighborhoodEstimated Value: $14,235 - $134,000
2
Beds
1
Bath
868
Sq Ft
$62/Sq Ft
Est. Value
About This Home
This home is located at 1311 Laurel St, Des Moines, IA 50314 and is currently estimated at $53,559, approximately $61 per square foot. 1311 Laurel St is a home located in Polk County with nearby schools including Callanan Middle School, Roosevelt High School, and Holy Family Catholic School.
Ownership History
Date
Name
Owned For
Owner Type
Purchase Details
Closed on
Nov 8, 2024
Sold by
Garman James
Bought by
Shade Steven Scott
Current Estimated Value
Purchase Details
Closed on
Sep 27, 2024
Sold by
Spellman Ben
Bought by
Shade Steven Scott
Purchase Details
Closed on
Jun 18, 2021
Sold by
Astilbe Morning Llc
Bought by
Spellman Ben and Garman James
Purchase Details
Closed on
Dec 26, 2018
Sold by
County Of Polk
Bought by
City Of Des Moines
Purchase Details
Closed on
Aug 4, 2011
Sold by
Aeon Financial Llc
Bought by
Drs Investments Llc
Purchase Details
Closed on
Jan 7, 2011
Sold by
Capitalsource Bank
Bought by
Aeon Financial Llc
Purchase Details
Closed on
Oct 4, 2010
Sold by
Calaway Antoine D
Bought by
Private Bank
Purchase Details
Closed on
Jul 25, 2007
Sold by
Calaway Virginia G
Bought by
Calaway Virginia G and Calaway Antoine Dennis
Create a Home Valuation Report for This Property
The Home Valuation Report is an in-depth analysis detailing your home's value as well as a comparison with similar homes in the area
Home Values in the Area
Average Home Value in this Area
Purchase History
| Date | Buyer | Sale Price | Title Company |
|---|---|---|---|
| Shade Steven Scott | -- | None Listed On Document | |
| Shade Steven Scott | -- | None Listed On Document | |
| Shade Steven Scott | -- | None Listed On Document | |
| Shade Steven Scott | $14,000 | None Listed On Document | |
| Spellman Ben | $9,800 | None Available | |
| City Of Des Moines | -- | None Available | |
| Drs Investments Llc | -- | None Available | |
| Aeon Financial Llc | -- | None Available | |
| Private Bank | -- | None Available | |
| Calaway Virginia G | -- | None Available |
Source: Public Records
Tax History Compared to Growth
Tax History
| Year | Tax Paid | Tax Assessment Tax Assessment Total Assessment is a certain percentage of the fair market value that is determined by local assessors to be the total taxable value of land and additions on the property. | Land | Improvement |
|---|---|---|---|---|
| 2025 | $232 | $7,300 | $7,300 | -- |
| 2024 | $232 | $6,200 | $6,200 | $0 |
| 2023 | $234 | $11,800 | $7,800 | $4,000 |
| 2022 | $232 | $9,900 | $5,900 | $4,000 |
| 2021 | $232 | $9,900 | $5,900 | $4,000 |
| 2020 | $242 | $9,300 | $5,300 | $4,000 |
| 2019 | $234 | $9,300 | $5,300 | $4,000 |
| 2018 | $1,042 | $8,700 | $4,700 | $4,000 |
| 2017 | $236 | $8,700 | $4,700 | $4,000 |
| 2016 | $230 | $8,700 | $4,700 | $4,000 |
| 2015 | $230 | $8,700 | $4,700 | $4,000 |
| 2014 | $484 | $18,200 | $4,900 | $13,300 |
Source: Public Records
Map
Nearby Homes
- 1054 14th St
- 0000 Keosauqua Way
- 1162 13th St
- 1021 11th St Unit 9
- 1004 Laurel St Unit 18
- 1167 11th St
- 1003 Day St Unit 23
- 1001 Day St Unit 24
- 1414 Goddard Ct
- 1505 University Ave
- 1107 18th St
- 1103 18th St
- 1159 18th St
- 1251 10th St
- 930 18th St
- 811 16th St
- 920 18th St
- 1311 10th St
- 1347 Forest Ave
- 1614 Center St
- 1315 Laurel St
- 1309 Laurel St
- 1319 Laurel St
- 1305 Laurel St
- 1109 14th St
- 1321 Laurel St
- 1108 13th St
- 1120 13th St
- 1310 Ascension St
- 1115 14th Place
- 1308 Ascension St
- 1318 Ascension St
- 1312 Laurel St
- 1316 Laurel St
- 1124 13th St
- 1304 Laurel St
- 1320 Laurel St
- 1107 & 1109 13th St
- 1050 13th St
- 1078 14th St