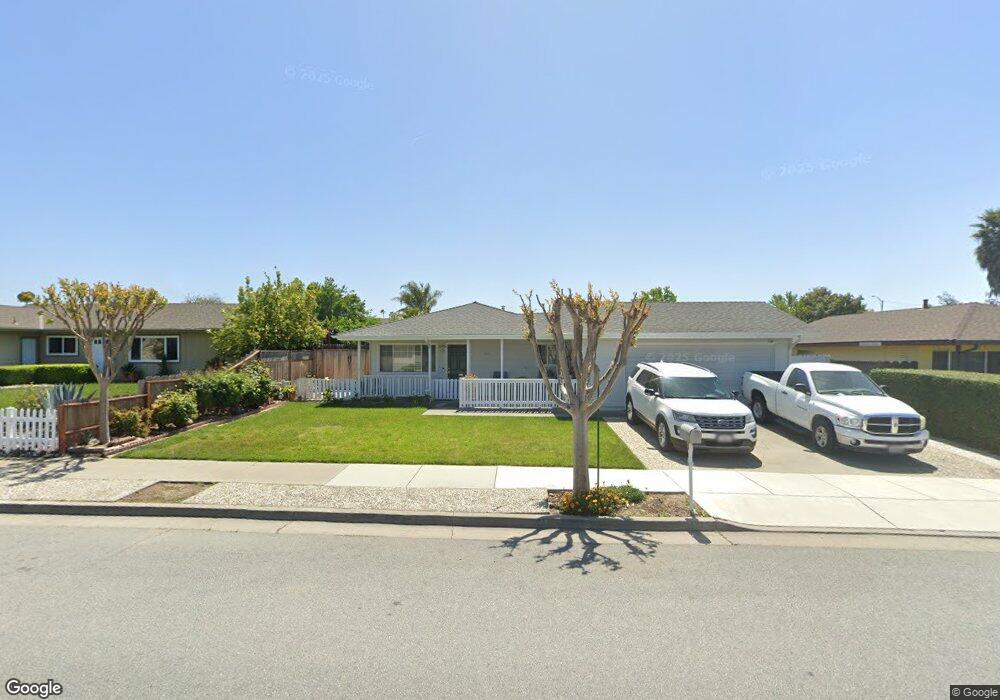
1311 Mesa Dr Hollister, CA 95023
Estimated Value: $506,319 - $741,000
--
Bed
--
Bath
--
Sq Ft
6,665
Sq Ft Lot
About This Home
This home is located at 1311 Mesa Dr, Hollister, CA 95023 and is currently estimated at $642,080. 1311 Mesa Dr is a home located in San Benito County with nearby schools including Cerra Vista Elementary School, Rancho San Justo School, and San Benito High School.
Ownership History
Date
Name
Owned For
Owner Type
Purchase Details
Closed on
Jun 29, 2021
Sold by
Sanchez Miguel A G
Bought by
Sanchez Miguel Arturo Gomez and Mae Linda
Current Estimated Value
Purchase Details
Closed on
Apr 9, 2021
Sold by
Sanchez Linda
Bought by
Sanchez Miguel A G
Home Financials for this Owner
Home Financials are based on the most recent Mortgage that was taken out on this home.
Original Mortgage
$384,750
Outstanding Balance
$347,383
Interest Rate
3%
Mortgage Type
New Conventional
Estimated Equity
$294,697
Purchase Details
Closed on
Oct 12, 2016
Sold by
Barrios Margie
Bought by
Barrios Xavier Edward and Barrios Margarit
Purchase Details
Closed on
Feb 26, 2016
Sold by
Andrade Mary Lou
Bought by
E & M Andrade Family Trust and Andrade Mary Lou
Purchase Details
Closed on
Jan 26, 2005
Sold by
Sanchez Luisa G
Bought by
Sanchez Luisa G and Sanchez Richard G
Create a Home Valuation Report for This Property
The Home Valuation Report is an in-depth analysis detailing your home's value as well as a comparison with similar homes in the area
Home Values in the Area
Average Home Value in this Area
Purchase History
| Date | Buyer | Sale Price | Title Company |
|---|---|---|---|
| Sanchez Miguel Arturo Gomez | -- | None Available | |
| Sanchez Miguel A G | -- | Chicago Title | |
| Sanchez Miguel A G | $405,000 | Chicago Title | |
| Barrios Xavier Edward | -- | None Available | |
| E & M Andrade Family Trust | -- | None Available | |
| Sanchez Luisa G | -- | -- |
Source: Public Records
Mortgage History
| Date | Status | Borrower | Loan Amount |
|---|---|---|---|
| Open | Sanchez Miguel A G | $384,750 |
Source: Public Records
Tax History Compared to Growth
Tax History
| Year | Tax Paid | Tax Assessment Tax Assessment Total Assessment is a certain percentage of the fair market value that is determined by local assessors to be the total taxable value of land and additions on the property. | Land | Improvement |
|---|---|---|---|---|
| 2025 | $7,621 | $642,045 | $222,577 | $419,468 |
| 2023 | $7,621 | $617,116 | $213,935 | $403,181 |
| 2022 | $7,358 | $605,017 | $209,741 | $395,276 |
| 2021 | $727 | $58,336 | $10,643 | $47,693 |
| 2020 | $731 | $57,738 | $10,534 | $47,204 |
| 2019 | $710 | $56,607 | $10,328 | $46,279 |
| 2018 | $694 | $55,498 | $10,126 | $45,372 |
| 2017 | $685 | $54,411 | $9,928 | $44,483 |
| 2016 | $640 | $53,345 | $9,734 | $43,611 |
| 2015 | $556 | $52,544 | $9,588 | $42,956 |
| 2014 | $522 | $51,516 | $9,401 | $42,115 |
Source: Public Records
Map
Nearby Homes
- 1231 Westward Dr
- 1361 Westward Dr
- 1120 Richard Rd
- 2102 White Oak Dr
- 2171 White Oak Dr
- 1941 Memorial Dr
- 1671 Monticello Dr
- 2110 Glenview Dr
- 2180 Clearview Dr
- 2141 White Oak Dr
- 2240 Preston Ct
- 1573 Valley View Rd
- 2230 Ventana Ct
- 2260 Ventana Ct
- 1590 Diablo Dr
- 1640 Sunset Dr
- 1180 Cherry Peak Way
- 2360 Valley View Rd
- 1101 Freedom Dr
- 2421 Valley View Rd