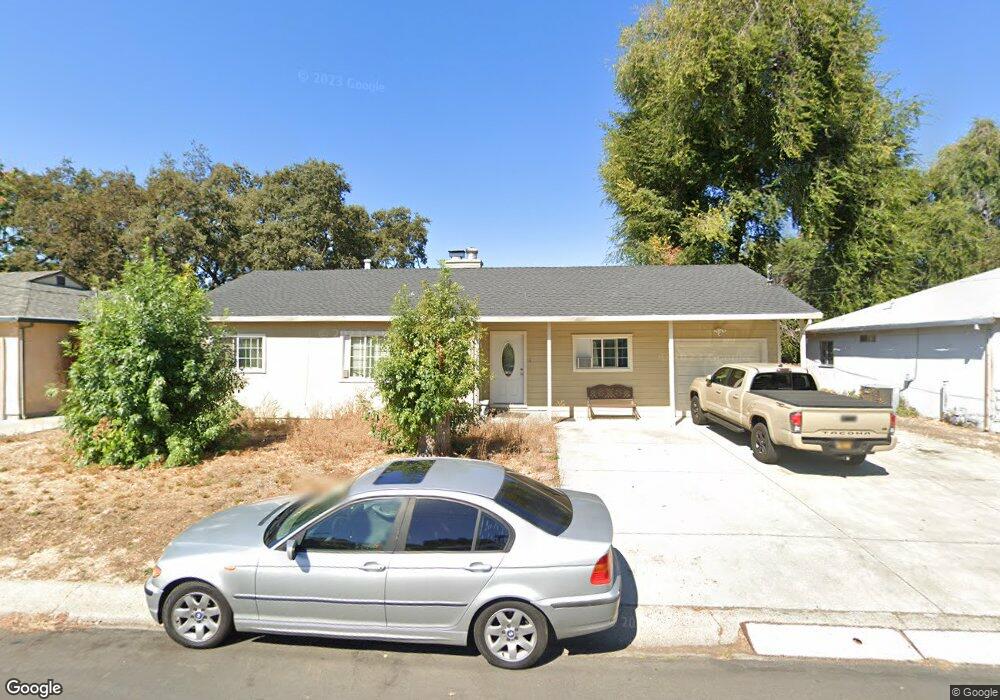
1311 Orange St Concord, CA 94518
Tree Haven NeighborhoodEstimated Value: $611,406 - $682,000
3
Beds
1
Bath
1,196
Sq Ft
$550/Sq Ft
Est. Value
About This Home
This home is located at 1311 Orange St, Concord, CA 94518 and is currently estimated at $657,602, approximately $549 per square foot. 1311 Orange St is a home located in Contra Costa County with nearby schools including Ygnacio Valley Elementary School, Oak Grove Middle School, and Ygnacio Valley High School.
Ownership History
Date
Name
Owned For
Owner Type
Purchase Details
Closed on
May 8, 2018
Sold by
Sturla Carlos Alberto and Sturla Alicia Hilda
Bought by
Sturla Carlos Alberto and Sturla Alicia Hilda
Current Estimated Value
Purchase Details
Closed on
Jun 23, 2008
Sold by
Argent Mortgage Co Llc
Bought by
Liquidation Properties Inc
Purchase Details
Closed on
Jan 11, 2007
Sold by
Alred Edward Gene and Alred Mary Francis
Bought by
Argent Mortgage Co Llc
Purchase Details
Closed on
Oct 28, 2005
Sold by
Tambasco Anthony R
Bought by
Alred Edward Gene and Alred Mary Francis
Home Financials for this Owner
Home Financials are based on the most recent Mortgage that was taken out on this home.
Original Mortgage
$371,200
Interest Rate
6.13%
Mortgage Type
Fannie Mae Freddie Mac
Create a Home Valuation Report for This Property
The Home Valuation Report is an in-depth analysis detailing your home's value as well as a comparison with similar homes in the area
Home Values in the Area
Average Home Value in this Area
Purchase History
| Date | Buyer | Sale Price | Title Company |
|---|---|---|---|
| Sturla Carlos Alberto | -- | None Available | |
| Liquidation Properties Inc | $236,500 | Lsi Title | |
| Sturla Carlos | $236,500 | Lsi Title | |
| Argent Mortgage Co Llc | $57,110 | Town & Country Title Service | |
| Alred Edward Gene | $464,000 | First American Title |
Source: Public Records
Mortgage History
| Date | Status | Borrower | Loan Amount |
|---|---|---|---|
| Previous Owner | Alred Edward Gene | $371,200 |
Source: Public Records
Tax History
| Year | Tax Paid | Tax Assessment Tax Assessment Total Assessment is a certain percentage of the fair market value that is determined by local assessors to be the total taxable value of land and additions on the property. | Land | Improvement |
|---|---|---|---|---|
| 2025 | $4,373 | $304,538 | $175,771 | $128,767 |
| 2024 | $4,156 | $298,568 | $172,325 | $126,243 |
| 2023 | $4,156 | $292,715 | $168,947 | $123,768 |
| 2022 | $4,085 | $286,977 | $165,635 | $121,342 |
| 2021 | $3,973 | $281,351 | $162,388 | $118,963 |
| 2019 | $3,888 | $273,008 | $157,572 | $115,436 |
| 2018 | $3,733 | $267,656 | $154,483 | $113,173 |
| 2017 | $3,600 | $262,408 | $151,454 | $110,954 |
| 2016 | $3,483 | $257,264 | $148,485 | $108,779 |
| 2015 | $3,423 | $253,401 | $146,255 | $107,146 |
| 2014 | $3,346 | $248,439 | $143,391 | $105,048 |
Source: Public Records
Map
Nearby Homes
- 1459 Del Rio Cir Unit C
- 1040 Mohr Ln Unit C
- 1800 Gilardy Dr
- 1044 Mohr Ln Unit D
- 1045 Mohr Ln Unit B
- 1387 Del Rio Cir Unit D
- 1049 Mohr Ln Unit A
- 1369 Del Rio Cir Unit D
- 1369 Del Rio Cir Unit C
- 1391 Monument Blvd Unit 20
- 1035 Heckmann Ln
- 1110 Eureka Ln
- 1064 Mohr Ln Unit C
- 1360 Del Rio Ct Unit 4
- 1013 Mohr Ln Unit 2
- 1078 Mohr Ln Unit A
- 1134 Lovell Ct
- 1156 Carey Dr
- 959 Chandler Ct
- 2005 Sierra Rd
- 1291 Orange St
- 1331 Orange St
- 1384 Rosemary Ln
- 1271 Orange St
- 1376 Rosemary Ln
- 1049 Ernst Way
- 1051 Ernst Way
- 1300 Orange St
- 1280 Orange St
- 1368 Rosemary Ln
- 1320 Orange St
- 1260 Orange St Unit A
- 1390 Rosemary Ln
- 1251 Orange St
- 1340 Orange St
- 1360 Rosemary Ln
- 1240 Orange St
- 1048 Ernst Way
- 1291 Apple Dr
- 1271 Apple Dr
Your Personal Tour Guide
Ask me questions while you tour the home.