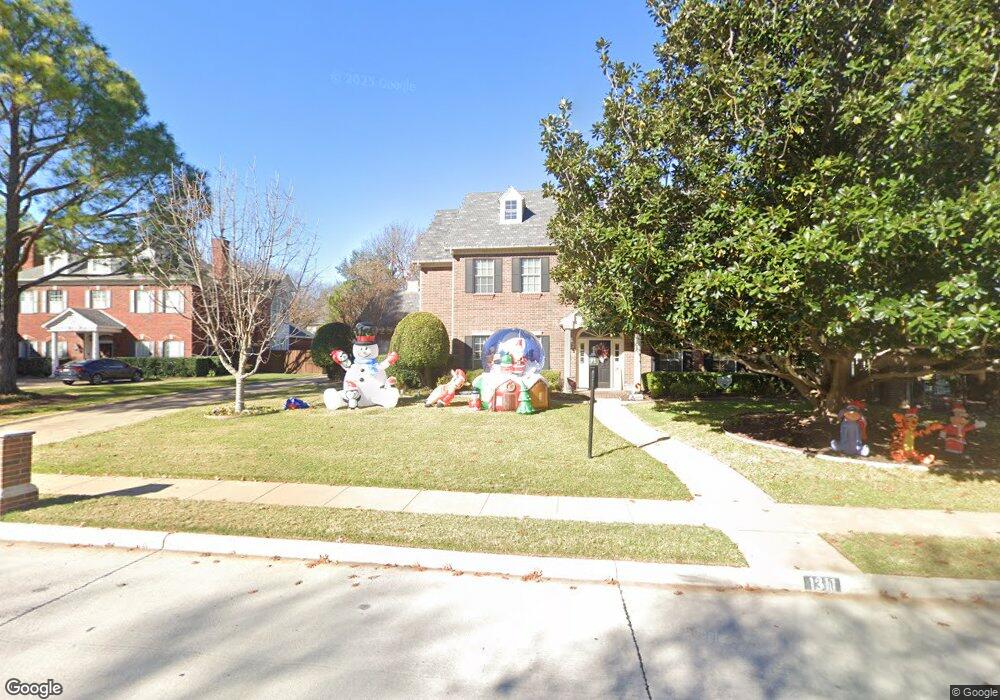
1311 Pecos Dr Southlake, TX 76092
Estimated Value: $939,000 - $1,082,000
3
Beds
3
Baths
2,915
Sq Ft
$351/Sq Ft
Est. Value
About This Home
This home is located at 1311 Pecos Dr, Southlake, TX 76092 and is currently estimated at $1,023,732, approximately $351 per square foot. 1311 Pecos Dr is a home located in Tarrant County with nearby schools including Don T. Durham Intermediate School, Walnut Grove Elementary School, and Carroll Middle School.
Ownership History
Date
Name
Owned For
Owner Type
Purchase Details
Closed on
Aug 25, 2017
Sold by
Worsham James Pattison and Worsham Sharalea Swanson
Bought by
Morales Miguel A and Morales Tracy R
Current Estimated Value
Home Financials for this Owner
Home Financials are based on the most recent Mortgage that was taken out on this home.
Original Mortgage
$420,000
Outstanding Balance
$351,294
Interest Rate
3.96%
Mortgage Type
New Conventional
Estimated Equity
$672,438
Purchase Details
Closed on
Jul 18, 2014
Sold by
Worsham James P and Worsham Sharalea S
Bought by
Worsham Family Revocable Living Trust
Purchase Details
Closed on
Feb 28, 1996
Sold by
Doty Charles L and Doty Mary V
Bought by
Worsham James P and Worsham Sharalea S
Home Financials for this Owner
Home Financials are based on the most recent Mortgage that was taken out on this home.
Original Mortgage
$158,200
Interest Rate
6.92%
Create a Home Valuation Report for This Property
The Home Valuation Report is an in-depth analysis detailing your home's value as well as a comparison with similar homes in the area
Home Values in the Area
Average Home Value in this Area
Purchase History
| Date | Buyer | Sale Price | Title Company |
|---|---|---|---|
| Morales Miguel A | -- | Fatco | |
| Worsham Family Revocable Living Trust | -- | None Available | |
| Worsham James P | -- | Safeco Land Title |
Source: Public Records
Mortgage History
| Date | Status | Borrower | Loan Amount |
|---|---|---|---|
| Open | Morales Miguel A | $420,000 | |
| Previous Owner | Worsham James P | $158,200 |
Source: Public Records
Tax History Compared to Growth
Tax History
| Year | Tax Paid | Tax Assessment Tax Assessment Total Assessment is a certain percentage of the fair market value that is determined by local assessors to be the total taxable value of land and additions on the property. | Land | Improvement |
|---|---|---|---|---|
| 2025 | $10,990 | $880,935 | $348,150 | $532,785 |
| 2024 | $10,990 | $880,935 | $348,150 | $532,785 |
| 2023 | $12,717 | $885,130 | $348,150 | $536,980 |
| 2022 | $13,684 | $686,225 | $232,100 | $454,125 |
| 2021 | $13,147 | $576,627 | $232,100 | $344,527 |
| 2020 | $12,228 | $531,989 | $208,890 | $323,099 |
| 2019 | $13,192 | $544,771 | $150,000 | $394,771 |
| 2018 | $11,777 | $519,771 | $130,000 | $389,771 |
| 2017 | $11,130 | $504,104 | $110,000 | $394,104 |
| 2016 | $10,118 | $444,009 | $110,000 | $334,009 |
| 2015 | $8,909 | $371,100 | $70,000 | $301,100 |
| 2014 | $8,909 | $371,100 | $70,000 | $301,100 |
Source: Public Records
Map
Nearby Homes
- 204 Southridge Lakes Pkwy
- 203 Donley Ct
- 550 N Peytonville Ave
- 207 Killdeer Trail
- 2530 & 2580 W Southlake Blvd
- 1712 Wild Rose Way
- 1340 Meadow Glen
- 203 Manor Place
- 403 Presidio Ct
- 1811 Redwing Ct
- 810 Brazos Dr
- 2116 Camden Cir
- 305 Sheffield Dr
- 1371 Holland Hill
- 205 Lovegrass Ln
- 503 Indian Paintbrush Way
- 1807 Mesquite Ct
- 904 Palos Verdes Trail
- 2009 Montecito Trail
- 300 Shady Oaks Dr