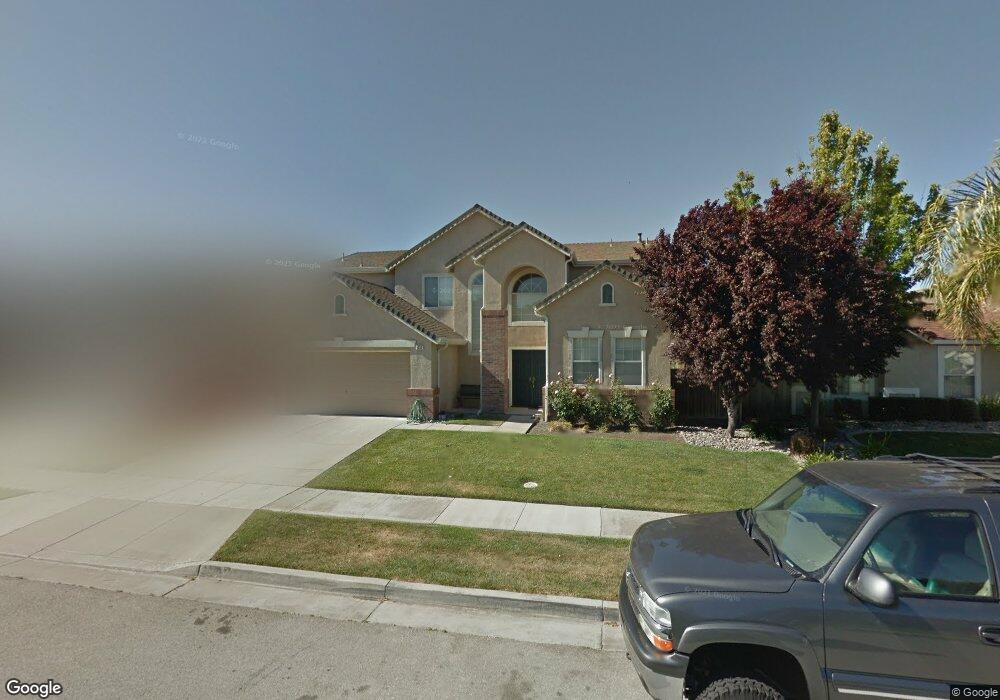
1311 Peregrine Dr Gilroy, CA 95020
Las Animas NeighborhoodEstimated Value: $1,096,945 - $1,245,000
4
Beds
3
Baths
2,203
Sq Ft
$529/Sq Ft
Est. Value
About This Home
This home is located at 1311 Peregrine Dr, Gilroy, CA 95020 and is currently estimated at $1,166,486, approximately $529 per square foot. 1311 Peregrine Dr is a home located in Santa Clara County with nearby schools including Luigi Aprea Elementary School, Brownell Middle School, and Solorsano Middle School.
Ownership History
Date
Name
Owned For
Owner Type
Purchase Details
Closed on
Aug 8, 2013
Sold by
Donnelley Dennis
Bought by
Donnelley Dennis
Current Estimated Value
Home Financials for this Owner
Home Financials are based on the most recent Mortgage that was taken out on this home.
Original Mortgage
$97,000
Outstanding Balance
$72,651
Interest Rate
4.57%
Mortgage Type
Credit Line Revolving
Estimated Equity
$1,093,835
Purchase Details
Closed on
Jun 7, 2001
Sold by
Donnelley Jennifer
Bought by
Donnelley Dennis
Home Financials for this Owner
Home Financials are based on the most recent Mortgage that was taken out on this home.
Original Mortgage
$481,250
Outstanding Balance
$183,318
Interest Rate
7.14%
Mortgage Type
Stand Alone First
Estimated Equity
$983,168
Purchase Details
Closed on
Nov 17, 1997
Sold by
Kaufman & Broad Monterey Bay Inc
Bought by
Donnelley Dennis and Donnelley Jennifer
Home Financials for this Owner
Home Financials are based on the most recent Mortgage that was taken out on this home.
Original Mortgage
$183,000
Interest Rate
7.33%
Create a Home Valuation Report for This Property
The Home Valuation Report is an in-depth analysis detailing your home's value as well as a comparison with similar homes in the area
Home Values in the Area
Average Home Value in this Area
Purchase History
| Date | Buyer | Sale Price | Title Company |
|---|---|---|---|
| Donnelley Dennis | -- | American Title Inc | |
| Donnelley Dennis | -- | Fidelity National Title | |
| Donnelley Dennis | $277,000 | First American Title Guarant |
Source: Public Records
Mortgage History
| Date | Status | Borrower | Loan Amount |
|---|---|---|---|
| Open | Donnelley Dennis | $97,000 | |
| Open | Donnelley Dennis | $481,250 | |
| Closed | Donnelley Dennis | $183,000 |
Source: Public Records
Tax History Compared to Growth
Tax History
| Year | Tax Paid | Tax Assessment Tax Assessment Total Assessment is a certain percentage of the fair market value that is determined by local assessors to be the total taxable value of land and additions on the property. | Land | Improvement |
|---|---|---|---|---|
| 2025 | $5,785 | $477,880 | $199,584 | $278,296 |
| 2024 | $5,785 | $468,511 | $195,671 | $272,840 |
| 2023 | $5,750 | $459,326 | $191,835 | $267,491 |
| 2022 | $5,653 | $450,321 | $188,074 | $262,247 |
| 2021 | $5,626 | $441,492 | $184,387 | $257,105 |
| 2020 | $5,563 | $436,966 | $182,497 | $254,469 |
| 2019 | $5,510 | $428,399 | $178,919 | $249,480 |
| 2018 | $5,146 | $420,000 | $175,411 | $244,589 |
| 2017 | $5,251 | $411,766 | $171,972 | $239,794 |
| 2016 | $5,141 | $403,693 | $168,600 | $235,093 |
| 2015 | $4,851 | $397,630 | $166,068 | $231,562 |
| 2014 | $4,819 | $389,842 | $162,815 | $227,027 |
Source: Public Records
Map
Nearby Homes
- 1469 Eagles Nest Ln
- 1080 Sunrise Dr
- 1515 Dovetail Way
- 9850 Bobcat Ct
- 9632 Cherrywood Ct
- 9938 Bobcat Ct
- 821 Koshare St
- 9881 Rancho Hills Dr
- 9650 Santa Teresa Blvd
- 0 Geri Ln
- 9214 Orinda Way
- 1469 Goshawk Ct
- 1482 Goshawk Ct
- 1810 Carob Ct
- 9110 Tea Tree Way
- 8940 Acorn Way
- 9250 Mahogany Ct
- 9045 Tea Tree Way
- 820 Woodcreek Way
- 2302 Hoya Ln
- 1321 Peregrine Dr
- 1307 Peregrine Dr
- 1310 Sunrise Dr
- 1300 Sunrise Dr
- 1331 Peregrine Dr
- 1320 Sunrise Dr
- 1301 Peregrine Dr
- 1290 Sunrise Dr
- 1330 Sunrise Dr
- 1320 Peregrine Dr
- 1310 Peregrine Dr
- 1341 Peregrine Dr
- 1330 Peregrine Dr
- 1280 Sunrise Dr
- 9640 Eagle View Way
- 1340 Sunrise Dr
- 9630 Eagle View Way
- 1351 Peregrine Dr
- 9620 Eagle View Way
- 9611 Eagle View Way