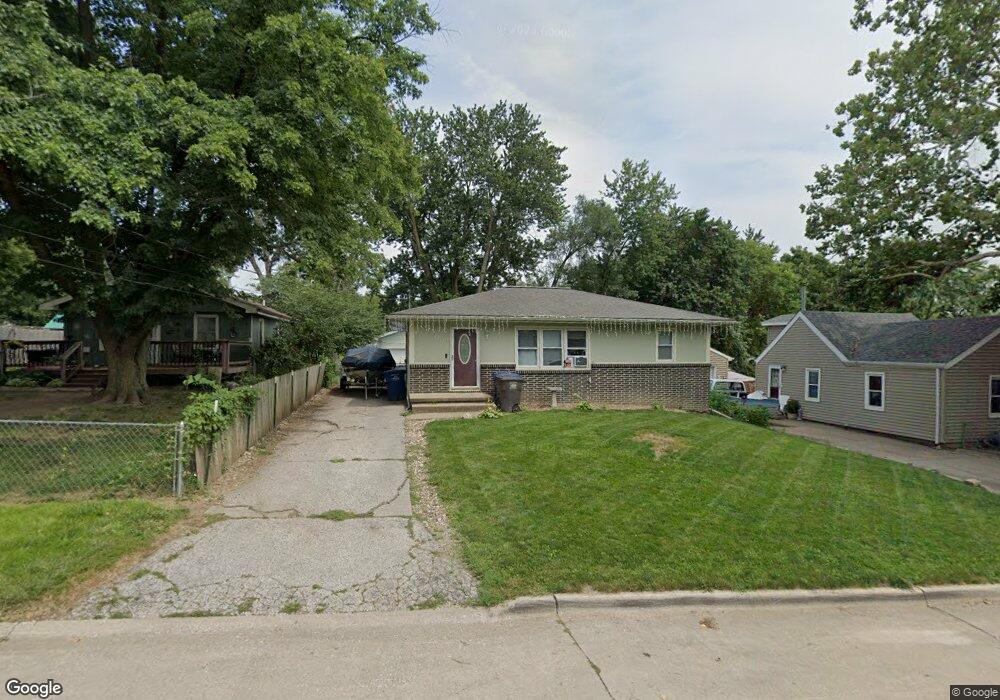
1311 Rittenhouse St Des Moines, IA 50315
Watrous South NeighborhoodEstimated Value: $184,000 - $198,210
3
Beds
1
Bath
910
Sq Ft
$210/Sq Ft
Est. Value
About This Home
This home is located at 1311 Rittenhouse St, Des Moines, IA 50315 and is currently estimated at $191,553, approximately $210 per square foot. 1311 Rittenhouse St is a home located in Polk County with nearby schools including Morris Elementary School, Mccombs Middle School, and Lincoln High School.
Ownership History
Date
Name
Owned For
Owner Type
Purchase Details
Closed on
May 21, 2012
Sold by
Messer Allen H and Messer Cindy S
Bought by
Cosner Bradley J and Cosner Deborah L
Current Estimated Value
Home Financials for this Owner
Home Financials are based on the most recent Mortgage that was taken out on this home.
Original Mortgage
$74,786
Outstanding Balance
$10,372
Interest Rate
3.5%
Mortgage Type
FHA
Estimated Equity
$181,181
Purchase Details
Closed on
Dec 16, 2010
Sold by
Loffredo Gihring Deborah
Bought by
Messer Allen H and Messer Cindy S
Purchase Details
Closed on
Dec 15, 2004
Sold by
Gibribg Rodney
Bought by
Loffredo Gihring Deborah
Purchase Details
Closed on
Jul 21, 1999
Sold by
Charlene G Cole Revocable Trust
Bought by
Gihring Rodney and Loffredo Gihring Deborah Lynn
Home Financials for this Owner
Home Financials are based on the most recent Mortgage that was taken out on this home.
Original Mortgage
$50,000
Interest Rate
7.23%
Create a Home Valuation Report for This Property
The Home Valuation Report is an in-depth analysis detailing your home's value as well as a comparison with similar homes in the area
Home Values in the Area
Average Home Value in this Area
Purchase History
| Date | Buyer | Sale Price | Title Company |
|---|---|---|---|
| Cosner Bradley J | $76,000 | None Available | |
| Messer Allen H | $77,000 | None Available | |
| Loffredo Gihring Deborah | -- | None Available | |
| Gihring Rodney | $47,000 | -- |
Source: Public Records
Mortgage History
| Date | Status | Borrower | Loan Amount |
|---|---|---|---|
| Open | Cosner Bradley J | $74,786 | |
| Previous Owner | Gihring Rodney | $50,000 |
Source: Public Records
Tax History Compared to Growth
Tax History
| Year | Tax Paid | Tax Assessment Tax Assessment Total Assessment is a certain percentage of the fair market value that is determined by local assessors to be the total taxable value of land and additions on the property. | Land | Improvement |
|---|---|---|---|---|
| 2025 | $3,060 | $186,800 | $28,300 | $158,500 |
| 2024 | $3,060 | $166,000 | $24,700 | $141,300 |
| 2023 | $2,838 | $166,000 | $24,700 | $141,300 |
| 2022 | $2,814 | $129,300 | $20,200 | $109,100 |
| 2021 | $2,582 | $129,300 | $20,200 | $109,100 |
| 2020 | $2,678 | $112,100 | $17,400 | $94,700 |
| 2019 | $2,498 | $112,100 | $17,400 | $94,700 |
| 2018 | $2,468 | $101,500 | $15,500 | $86,000 |
| 2017 | $2,526 | $101,500 | $15,500 | $86,000 |
| 2016 | $2,148 | $101,900 | $14,700 | $87,200 |
| 2015 | $2,148 | $90,200 | $14,700 | $75,500 |
| 2014 | $2,258 | $93,700 | $15,000 | $78,700 |
Source: Public Records
Map
Nearby Homes
- 1313 Burnham Ave
- 1334 Wade St
- 1115 Rittenhouse St
- 1161 Bundy St
- 1115 Wade St
- 1306 Amos Ave
- 7205 SW 13th St
- 1225 West St
- 1029 Bundy St
- 1310 Leland Ave
- 7306 SW 16th St
- 1010 Amos Ave
- 7500 SW 12th St
- 1214 Leland Ave
- 7460 Southview Dr
- 1500 Leland Ave
- 6205 SW 12th St
- 6107 SW 14th St
- 6001 SW 13th Place
- 1419 Payton Ave
- 1309 Rittenhouse St
- 1313 Rittenhouse St
- 1315 Rittenhouse St
- 1307 Rittenhouse St
- 1310 Burnham Ave
- 1312 Burnham Ave
- 1308 Burnham Ave
- 1317 Rittenhouse St
- 1314 Burnham Ave
- 1310 Rittenhouse St
- 1312 Rittenhouse St
- 1308 Rittenhouse St
- 1304 Burnham Ave
- 1305 Rittenhouse St
- 1321 Rittenhouse St
- 1306 Rittenhouse St
- 1316 Burnham Ave
- 1314 Rittenhouse St
- 1304 Rittenhouse St
- 1302 Burnham Ave